by Meteorologist Kerry Anderson
With drought conditions worsening here in the southwest the hope is that the strengthening El Nino portends the onset of significant rainfall this winter. I have heard talk about the “double El Nino” and I have been asked, “so just when will El Nino arrive?” Sorry folks El Nino will not arrive in Southern California, it is an equatorial Pacific anomaly that may have the effect bringing increased rainfall but that is not guaranteed.
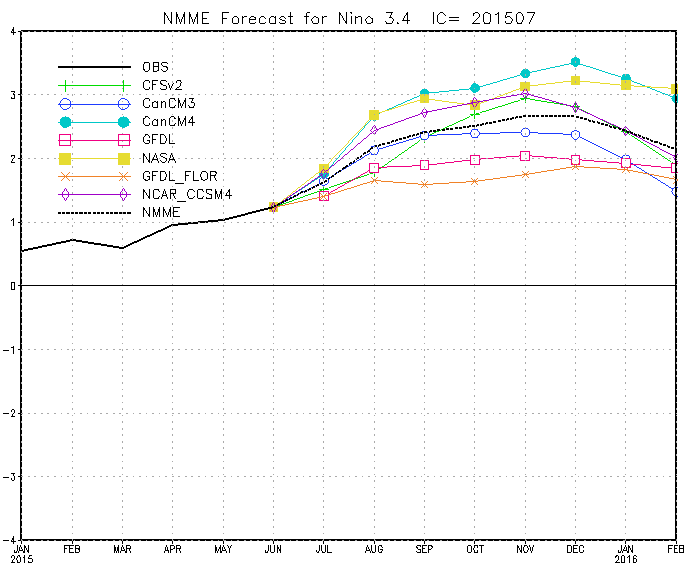
So what about a double El Nino. In my 30 years since becoming a meteorologist I have never heard of a double El Nino. It sounds like the latest cute media term that will become as overused as the “Polar Vortex”. Here is what we do know. We use an index call ENSO (El Nino Southern Oscillation) to rank the strength of an El Nino. In 1997, the strongest El Nino in recent history, the ENSO index was recorded to be 2.7. The graph below shows the latest published results of 8 computer models that forecast the strength of the ENSO index. At the start of July the ENSO index was recorded at 1.2. The models all predict that El Nino conditions will strengthen with some models predicting record breaking readings. The consensus forecast (black dotted line) predicts near record breaking conditions. So it may not be a double but it sure looks to be impressive.
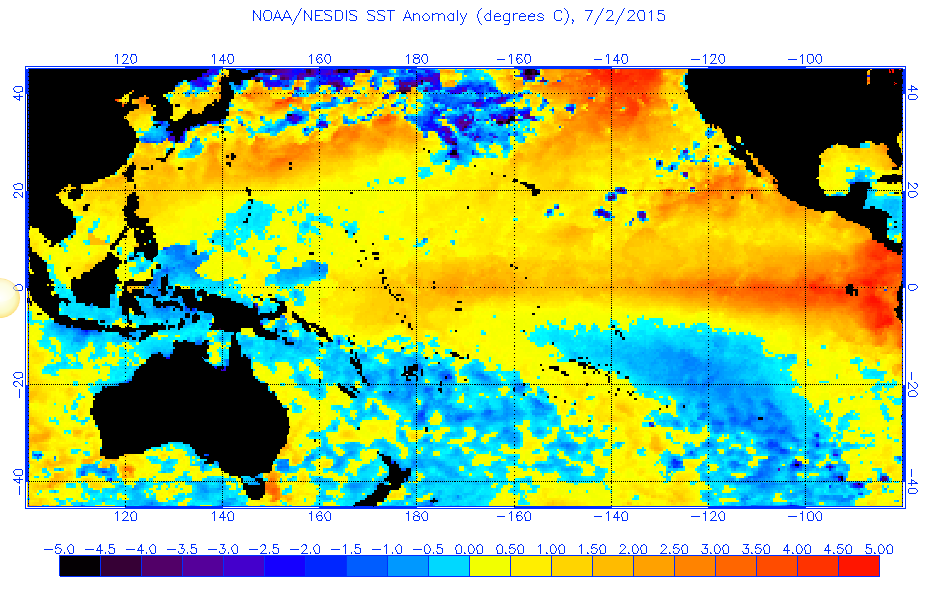
El Nino describes the condition that occurs in the Pacific Ocean along the equator when the trades winds decrease, upwelling along the South American coastline decreases and warmer than normal ocean waters develop off the coastline of Peru and spread across the Pacific. (More on what is El Nino?) The latest Sea Surface Temperature observations indicate that the equatorial Pacific temperatures are increasing.
Since all the experts seem pretty certain of a strong El Nino shouldn’t that mean that we can start buying umbrellas here in Southern California? Take a look at the maps below produced by NOAA and published on Climate.gov. The first maps show the precipitation pattern during the strongest El Nino in our recorded history. The maps are arranged in descending order of El Nino strength. Take a look at the precipitation for the southwest.
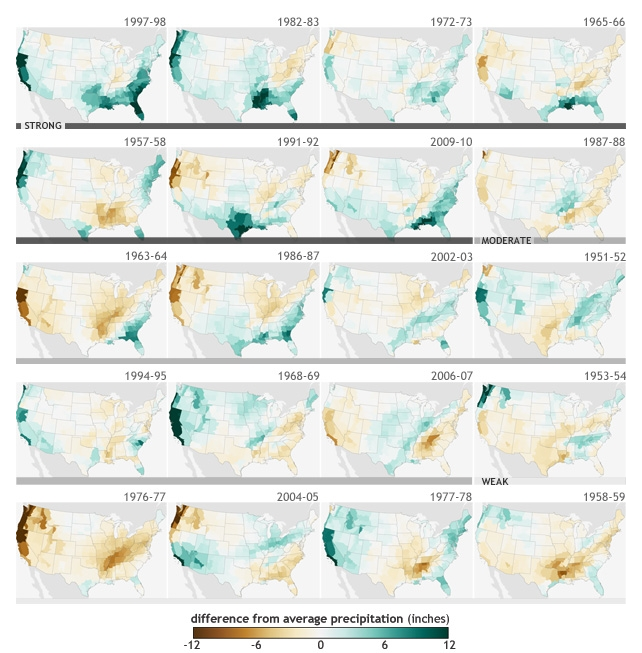
As you can see with the two strongest El Nino the Southwest saw above normal precipitation but in 1965/65, the third strongest event in our recent history California saw below normal precipitation. Based on this historical evidence it is apparent that we can’t simply watch for the El Nino signals and be certain that the rain will start to fall when winter comes.
You may have noticed that the Southeastern United States is more certain that an El Nino signals above normal precipitation. More next week on why this is.