By WeatherFlow meteorologist Shea Gibson.
As we get into the latter part of the spring, we start to see hotter air masses continuing to surge into the SE Region. This prompts a higher rate of instability and thunder-storming along the Sea Breeze fronts just inland of the coast. With water temps continuing to warm up, the surface decoupling issues start to slowly dissipate and convective outflow is able to help enhance the Sea Breeze circulations. BUT….we still have to watch for marine layering with these significantly hotter air masses until water temps warm to a mixing point. We also have to watch for cloud contamination as these thunderstorms flare up and are steered by the mid and upper level winds across and over the convergence zone(s). Breaching of the coast line and overunning of areas that exhaust the thermal lift zones ultimately kills the winds along the beach.
So we start by looking at what are a few ingredients of a consistent or perfect “thermally enhanced Sea Breeze” for the SC coast – which can include the following:
1. The night before…a modest W or NW downsloping land breeze in association with radiational cooling at night (can include a healthy inversion with a distant cold front to show moderate values for a period). Northeast Gulf High pressure can help supplement the overnight land breeze on its downsloping – and to keep its place and/or provide mid and upper level Westerly steering of lee-side/inland/piedmont troughing that spark areas of storming (hence outflows head west out towards the ocean to be cooled, condensed and circulated). These High’s can contain a “drifting” displaced lobe of mid or upper level high pressure to reach the Southern Appalachians. Too far north up the mountain chain and cloud contamination could occur with a more Northerly steering and/or sheering of cloud tops.
2. Into the day…robust Atlantic / Bermuda High pressure steering in a synoptic Southerly flow (8-12kts optimal for the starting point) and heating things up with dry air along the immediate coastline. This helps nudge the Sea Breeze front ashore in the morning hours.
3. Sea Surface Temps/ Water Surface Temps stay at least within 5-10 degrees of high air temps for surface mixing optimization. A 15-20 degree difference, by observations, tends to create decoupling issues/marine layering of some level or thickness. Recent obs pin the full coupling with hotter air masses reaching into the 90’s to SST 75°-76+ in temps observed May 19/20th as SST’s reached those marks. (There are some dynamic properties here in play…definitely up for discussion for hydrological points of view as to why there seems to be a threshold where the decoupling issues end).
4. Convective potential (CAPE) is extremely helpful for atmospheric mixing for increased height of vertical stacking. Healthy thunderstorm builds inland and across the piedmont to provide a streamlined ceiling of outflow.
Ok first up is the Sea Surface Temps in succession from 4/30/15 – 5/20-15…temps were right around 71 °-72 ° on May 11 and a more solid 72° on May 12 after a hot day.
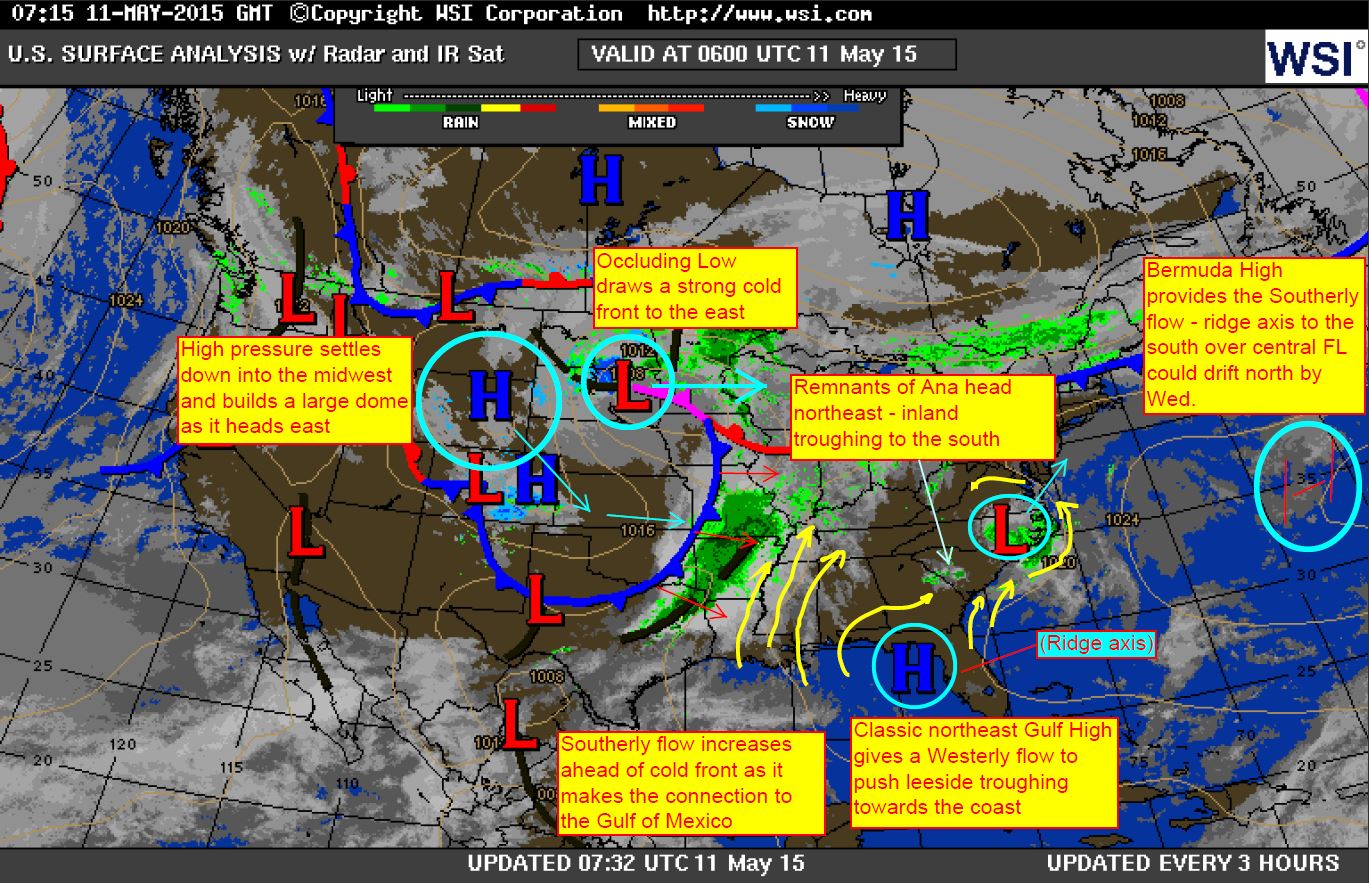
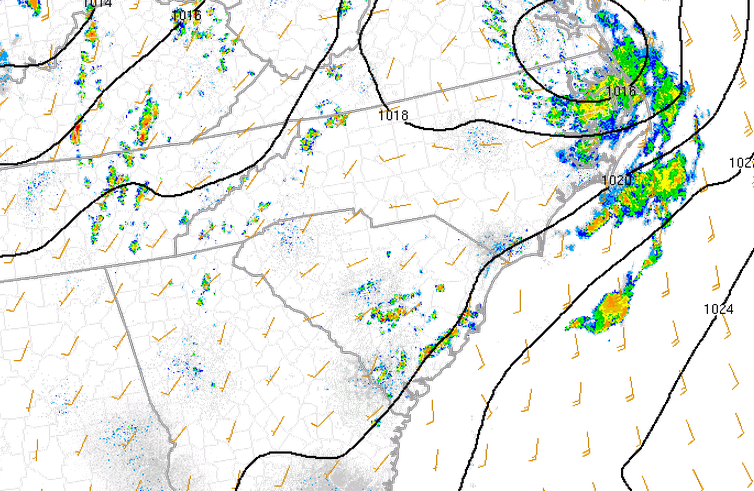
 Ok let’s dive right in to 5-11-15 and take a peek at the overall setup for the day…notice remnants of Ana still spinning along southeast NC – with leftover moisture/troughing to the southwest.
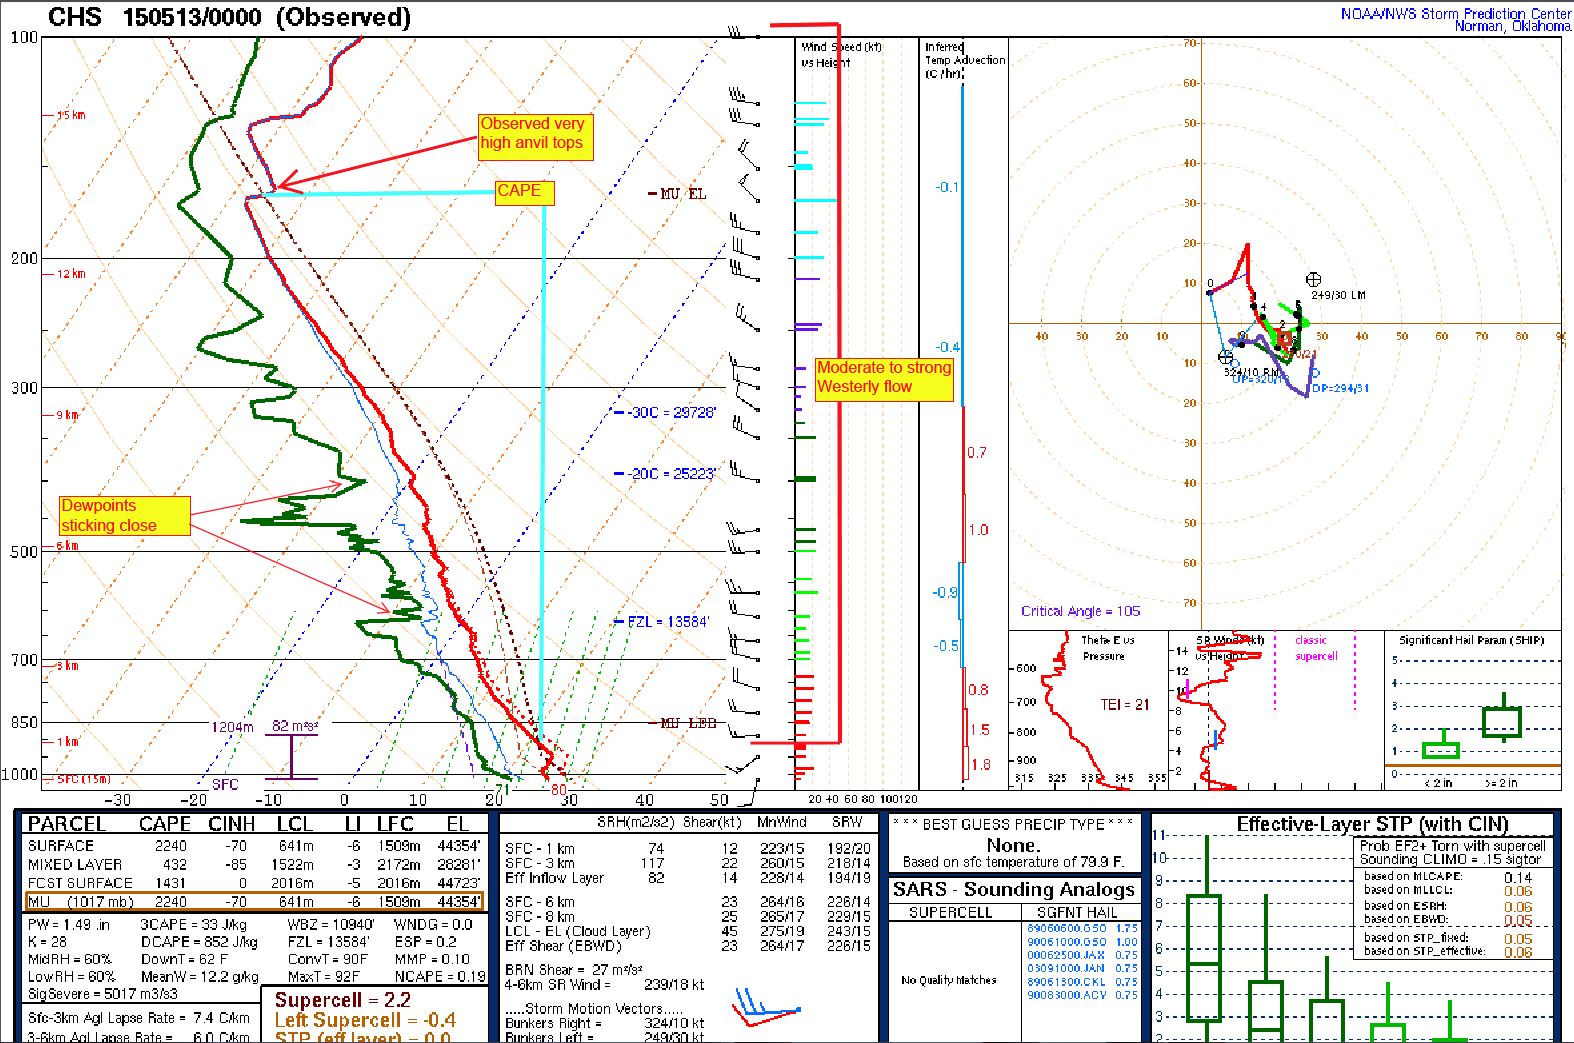
Here is the Rawindsonde Observation (RAOB) Skew T sounding for 5/11/15 at 12UTC (7am EST). We see a very slight inversion to start the morning out and the air drying very quickly as we ascend. The convection inhibition (CIN) covers the area between the ground and the level of free convection – or basically where the warm stable air layer is situated that is keeping the thin cooler layer below it from rising (preventing updrafting). Then as we go higher we see where that skews over towards the area where mixing can occur somewhere just above 850mb. That is where the Convective Available Potential Energy (CAPE) values begin and we see much higher potentials for instability/storm building properties proceed up to just above 200mb’s where equilibrium is met. That is the level where vertical cloud stacking would end. Notice the CIN where the thermal cap is a solid SW 20kt flow. Instability can only be achieved if that thermal cap is broken ..which this day was not a problem.
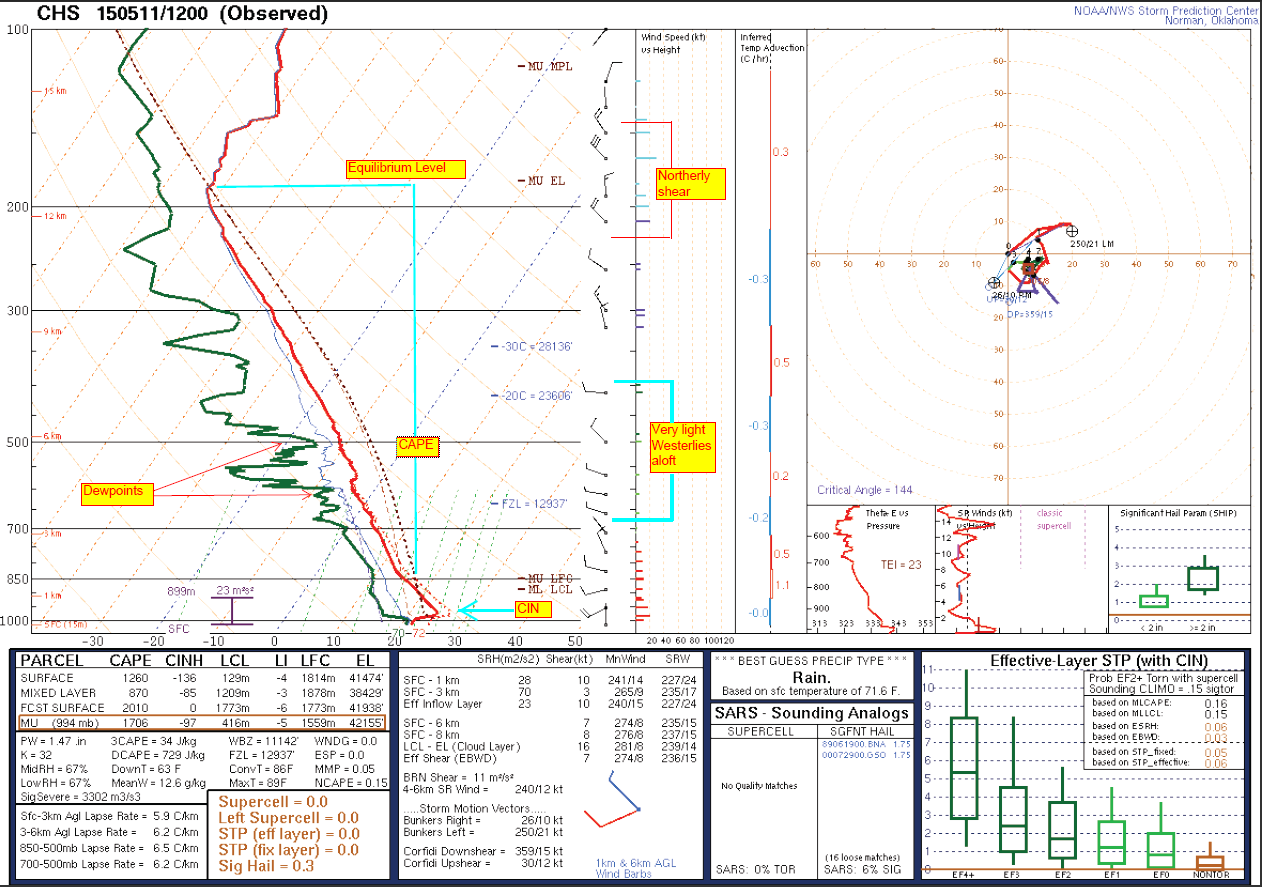
Surface CAPE is at a positive 1260 J/kg…mixed layer at 870 J/kg and forecast surface to be 2010 J/kg – or “large” for our area.
CAPE values in Joules per kilogram…

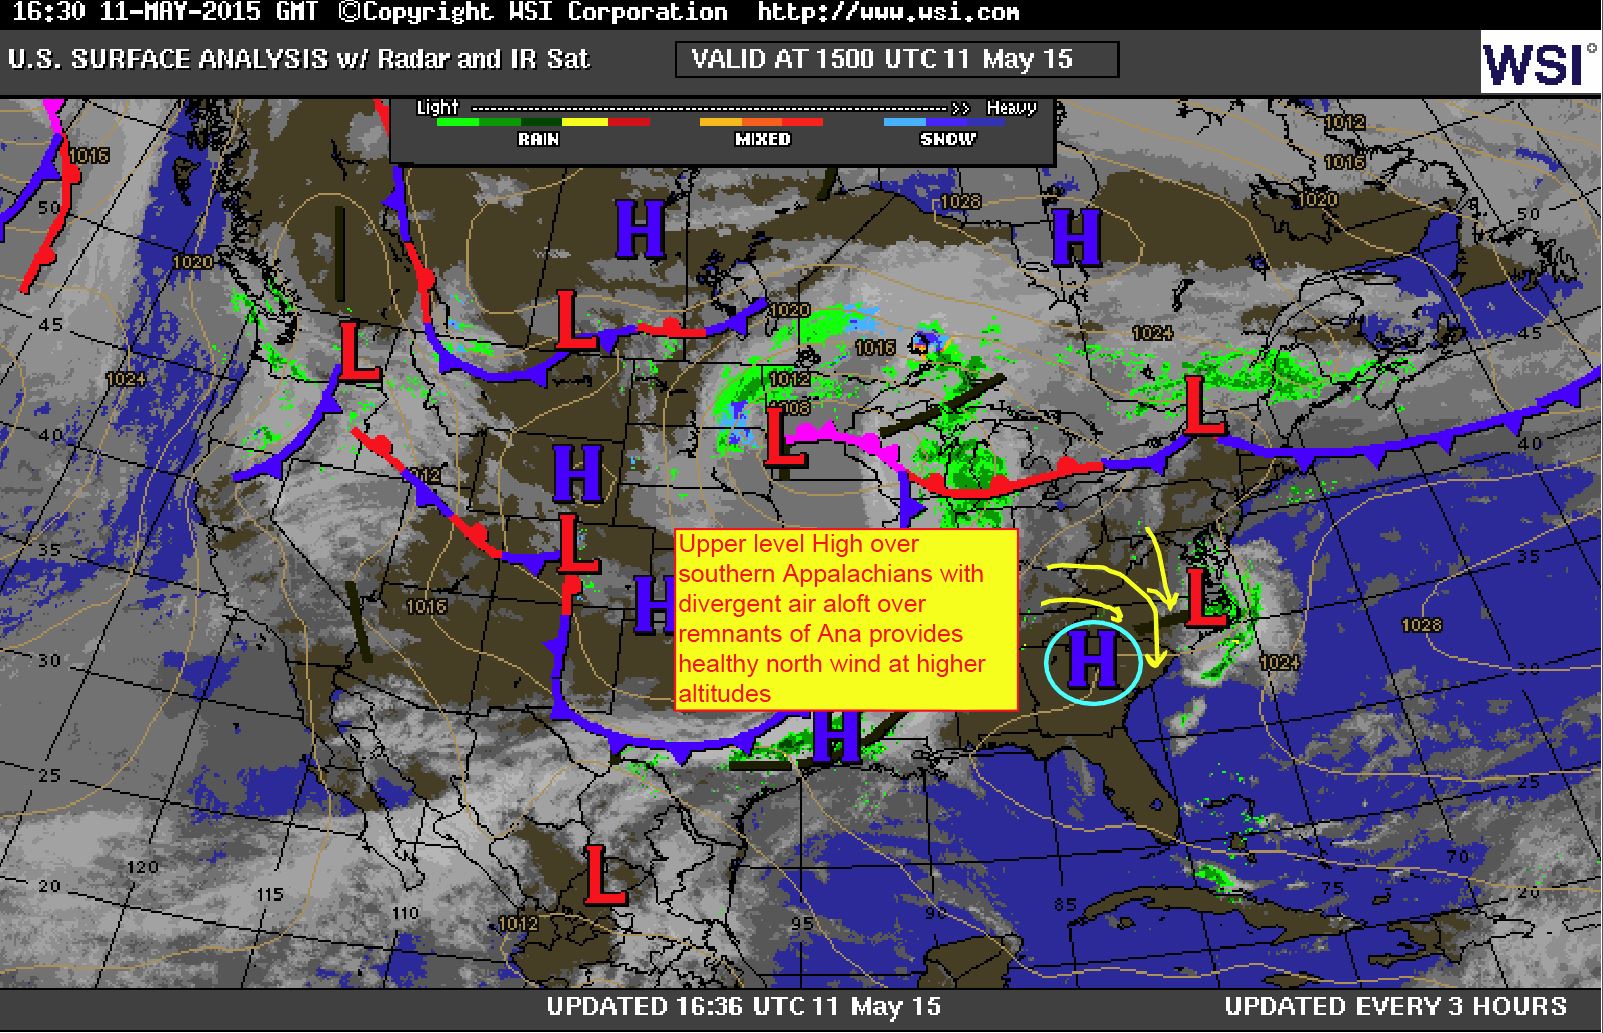
Here is an additional development of mid level High drifting up into the Southern Appalachians to show the divergent mid to upper level NW’erlies.
Quick double check of the 300mb jet stream to make sure we aren’t missing anything – checks out just fine. Frontal boundary lies just along the dip in the midwest with no mid or upper level factors. Nice little polar jet streak up the Mississippi River states with the subtropical jet barely feeding into it over Texas, but otherwise remaining weaker to the south.
Ok so let’s take a look at the forecast for the day…
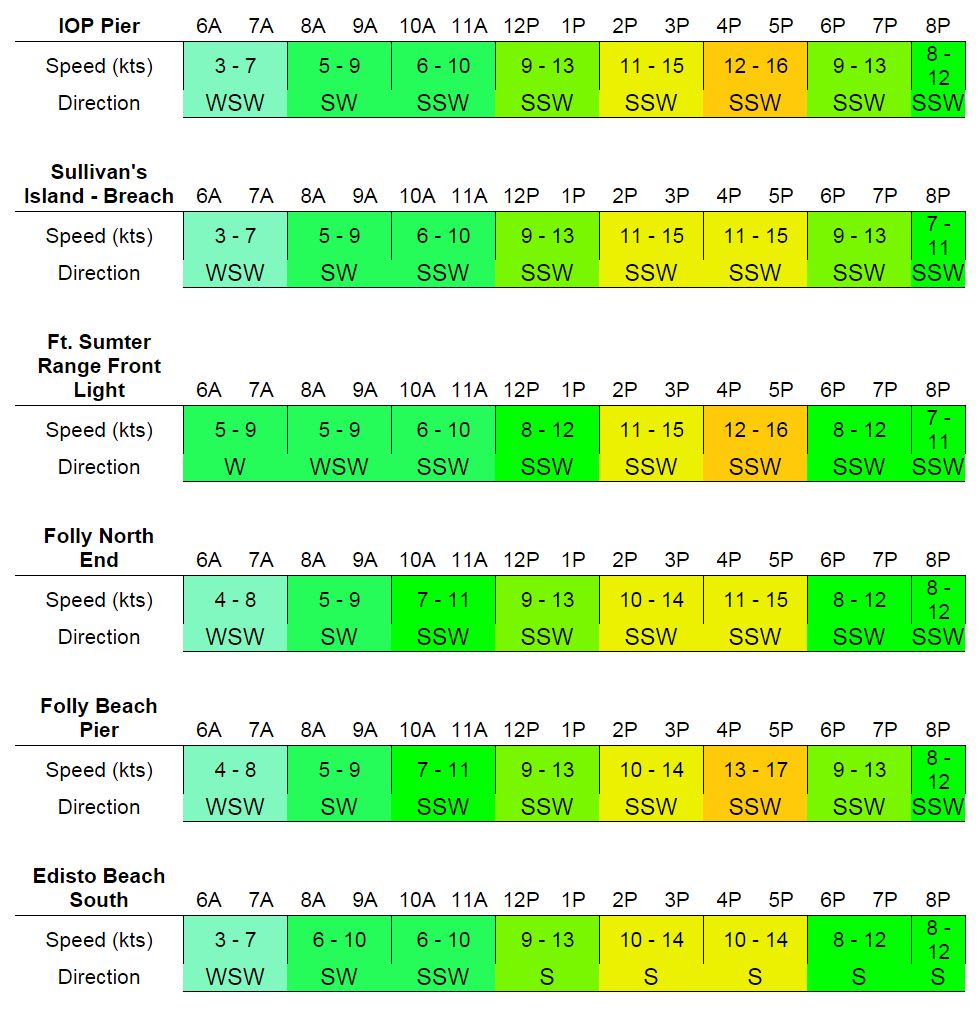
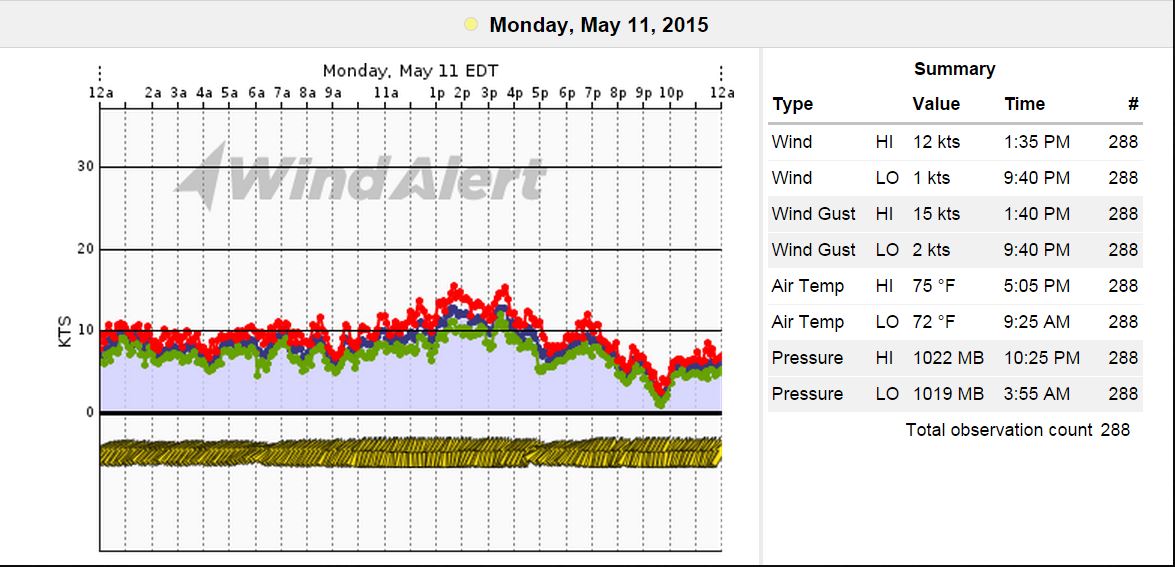
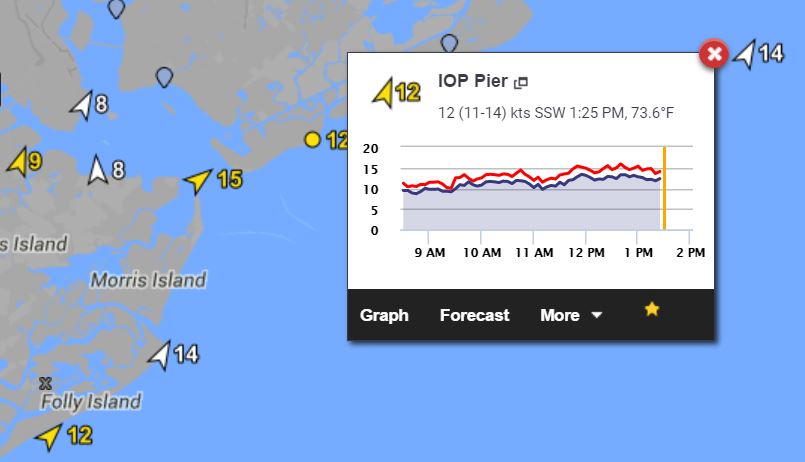
Graph for the day at Isle of Palms – I’d call this a win for us with winds peaking out just a bit early..but there is a good reason for this.
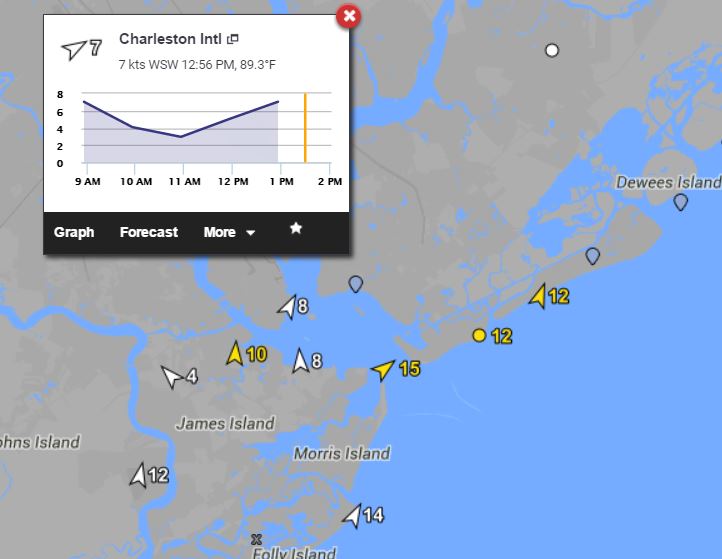
 Graph for the Charleston Harbor – a bit above values – but again for a good reason:
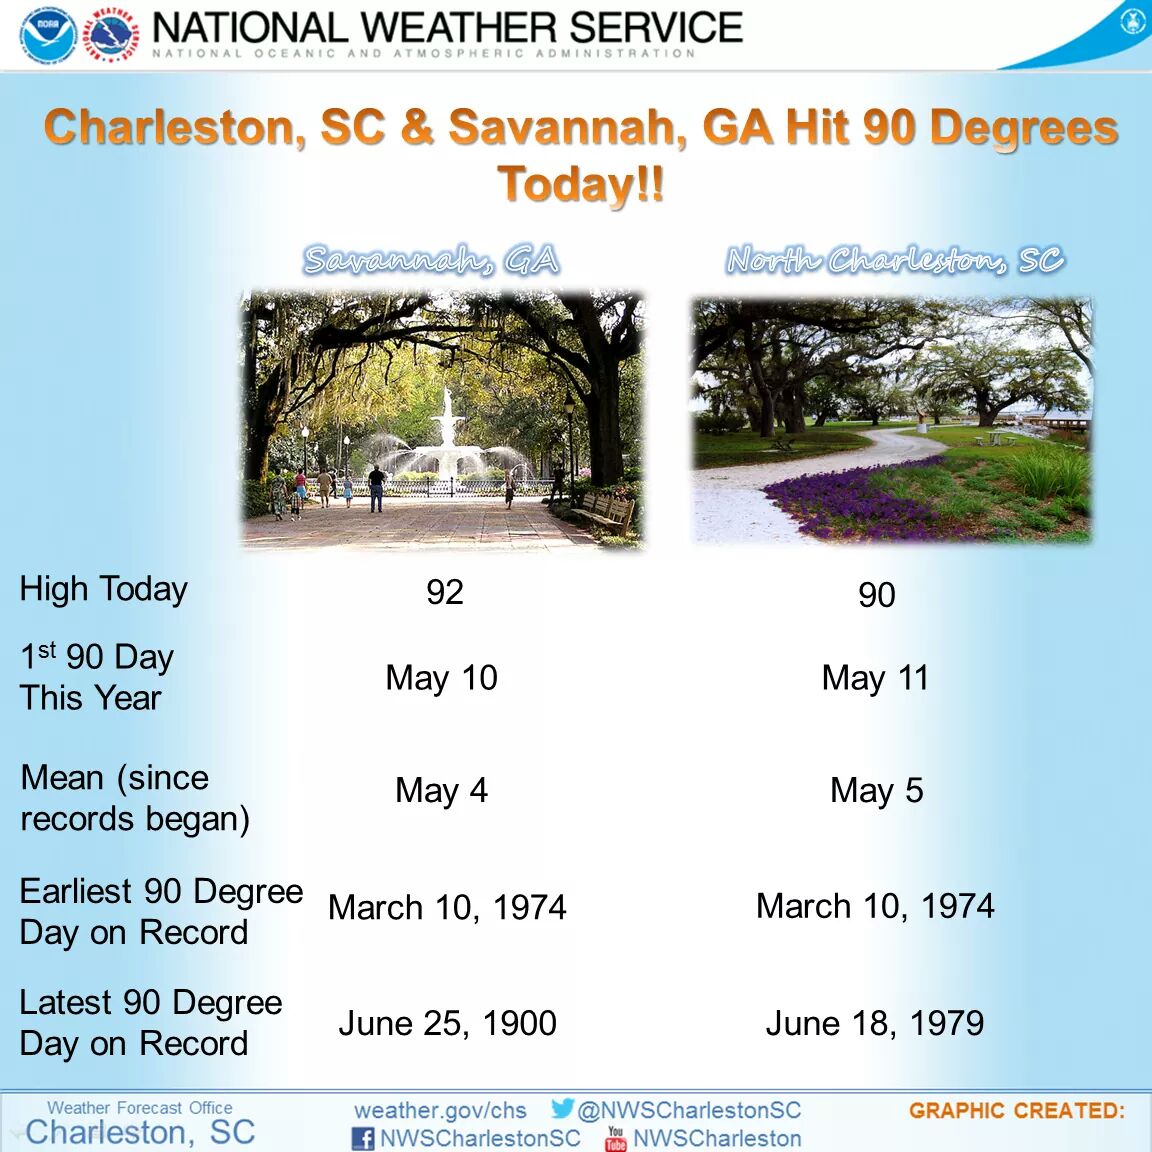
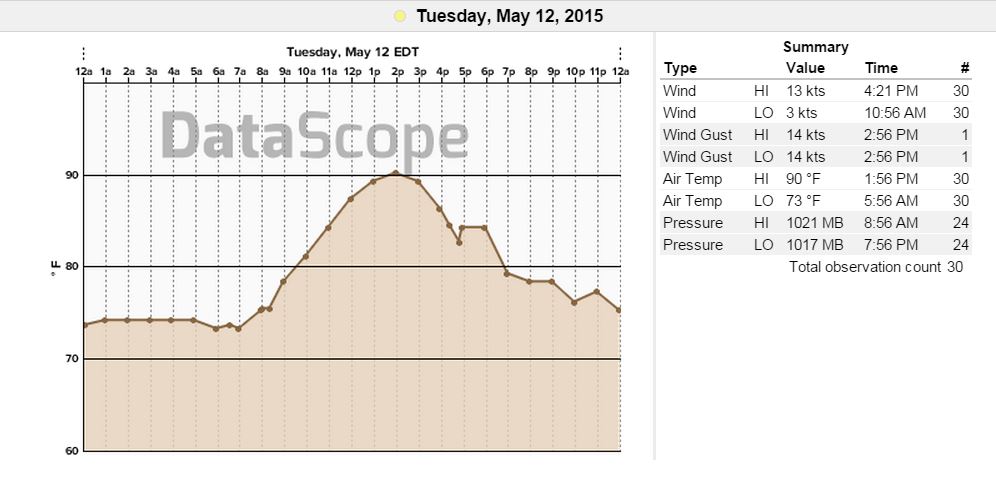
 This day’s air temps were predicted to be in the lower 80’s (along areas near the water)…but what happened was a record high air temp of 90° inland (perhaps a couple of degrees extra at other locales) as recorded by the US National Weather Service Charleston.
 Look at the difference it made when marine layering showed up and created a wider spread of air temps. See below graphs with info for a snapshot of the difference.
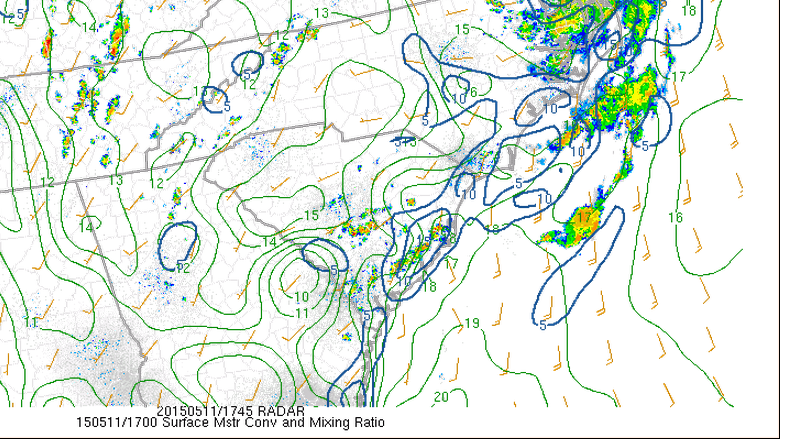
NOW…with this surge of hot air, we had a rather large line of thunderstorms develop inland along the Sea Breeze front. Here is WeatherFlow meteorologist Tim Kent’s SPC Mesoscale Analysis update to the team showing the unstable air masses and areas of convection.
Here are the radar loops for the day – notice the flare up of storms that get pushed from SW to NE with slow movement (Northerly sheer). This was a very lengthy line of storms spanning the entire SC coast.
Incredible outflow boundary setup for the evening.
Bottom line for May 11 for winds: Rapid heating with inland convection and Sea Breeze circulations were able to show a decent overall Sea Breeze setup. Ultimately, cloud contamination got the better of the coast, but marine layering was already showing its teeth to cap speeds in the low teens along beaches. I physically observed a thin haze and almost a fog bank forming along outer beaches. This also contributed to storms fizzling out over this stable air.
Here is the PM skew T as a follow up just to show how saturated the atmosphere was inland:

ON TO May 12…
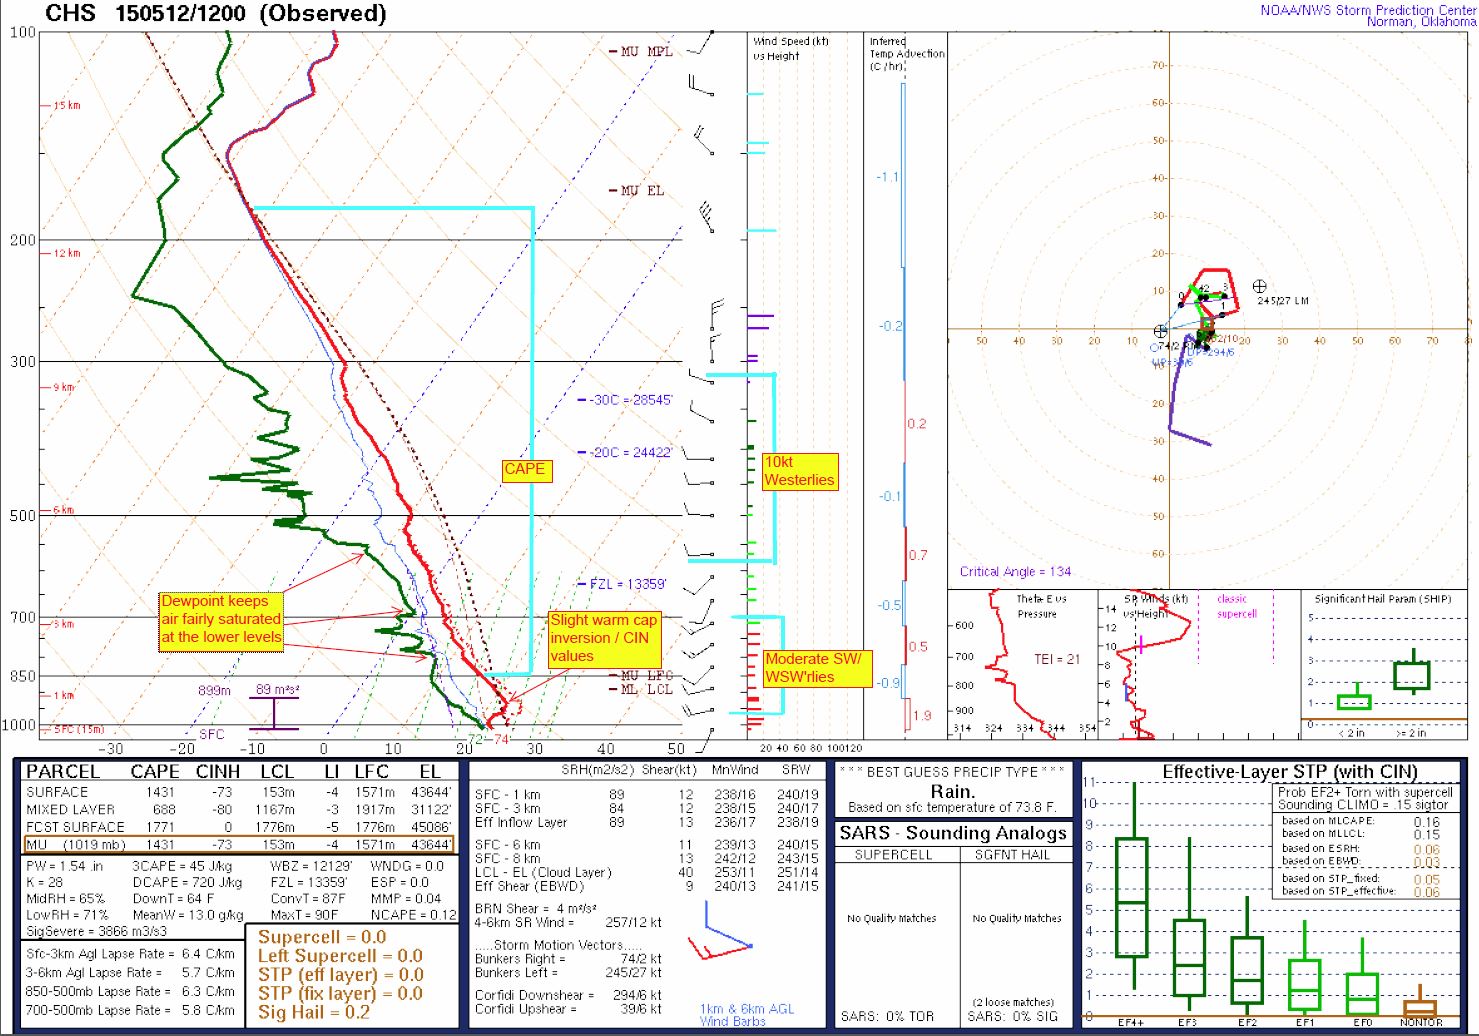
First let’s a take a look at the Skew T for the 7am sounding. The thing to gather here is less CAPE values for the day and dryer overall air higher (still a muggy air mass up until around 600mb’s) up as far the the Sea Breeze is concerned; however, that will change later as the cold front makes its way eastwards. The other thing to consider here is the mid level Westerlies lingering around 10kts for the sounding…not much but just enough of a spread to keep an easterly drive of clouding aloft for outflow to help enhance circulations just a bit. The inversion was much less pronounced to start the day and the thermal cap broke early – got some visual on earlier cumulus cloud building that morning to the west and north. The heavier upper sheer doesn’t have much effect until almost at the equilibrium level.
Double check of the jet stream analysis to make sure we still aren’t seeing any extra feed into the upper levels…fairly quiet there until later in the afternoon, where speeds do pick up.
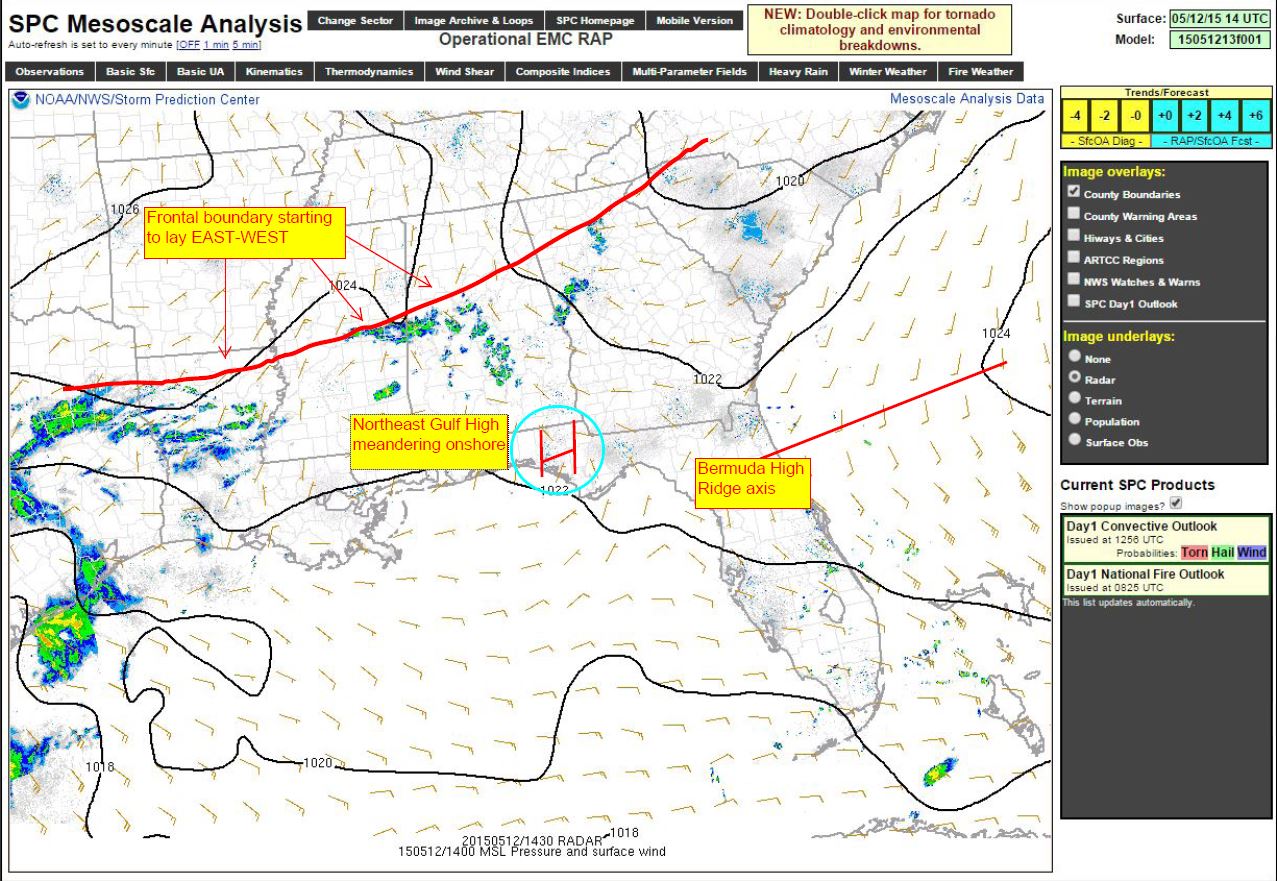
 Looking at the northeastern Gulf of Mexico, however, we do see the High right in place at 5:00AM (perhaps just a tad northwest of the inner curve). This is also helping with that mid level Westerly flow into SC. You can clearly see the synoptic Southerly flow up the SC coast already getting under way with tighter gradients residing out over the Gulf Stream. Frontal boundary forming convective areas along MS/AL/GA.
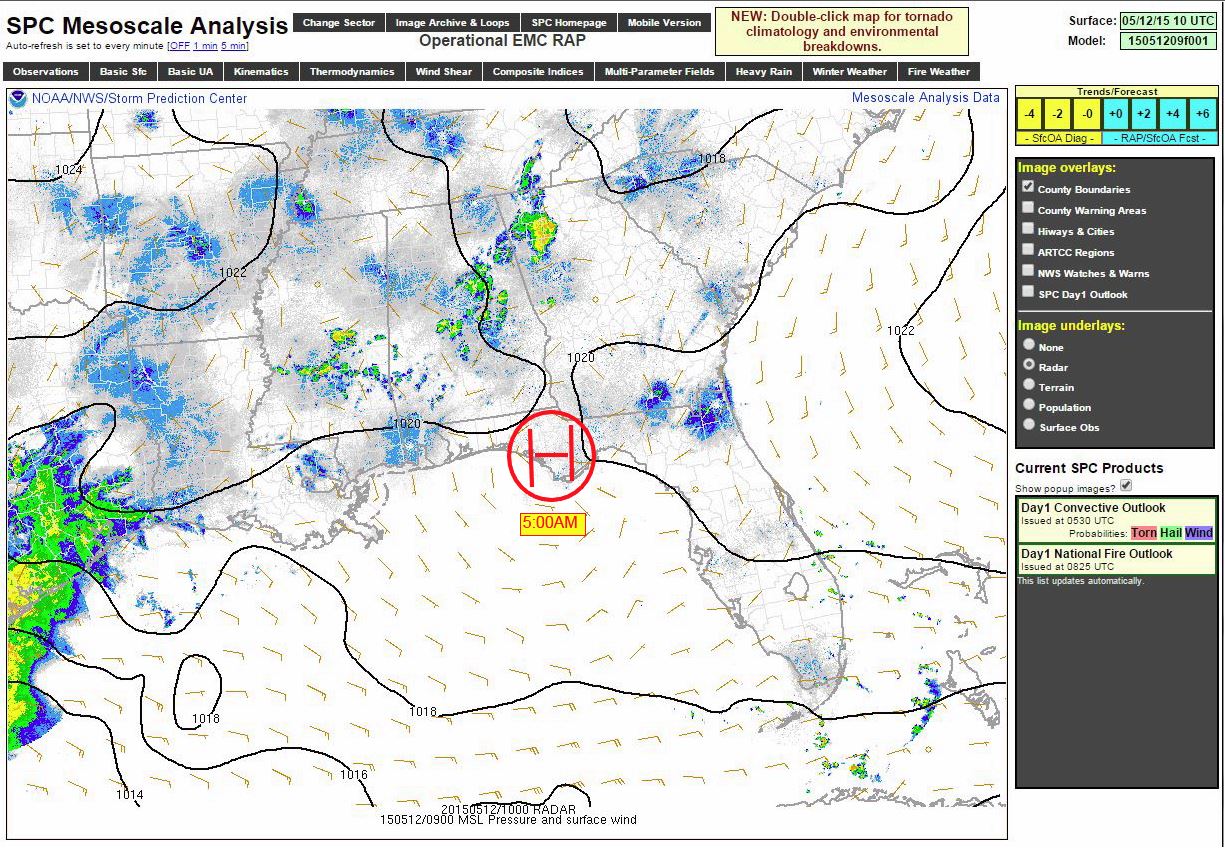 Here it is at 11:00AM – just wanted to show its migration pattern as it meanders around the inner Gulf curve of FL. Ridge axis to the east and frontal boundary becoming a bit more diagonal are likely culprits of a slightly stronger mid level Westerly flow over SC = sort of a zonal flow [squeezing] up into the state.
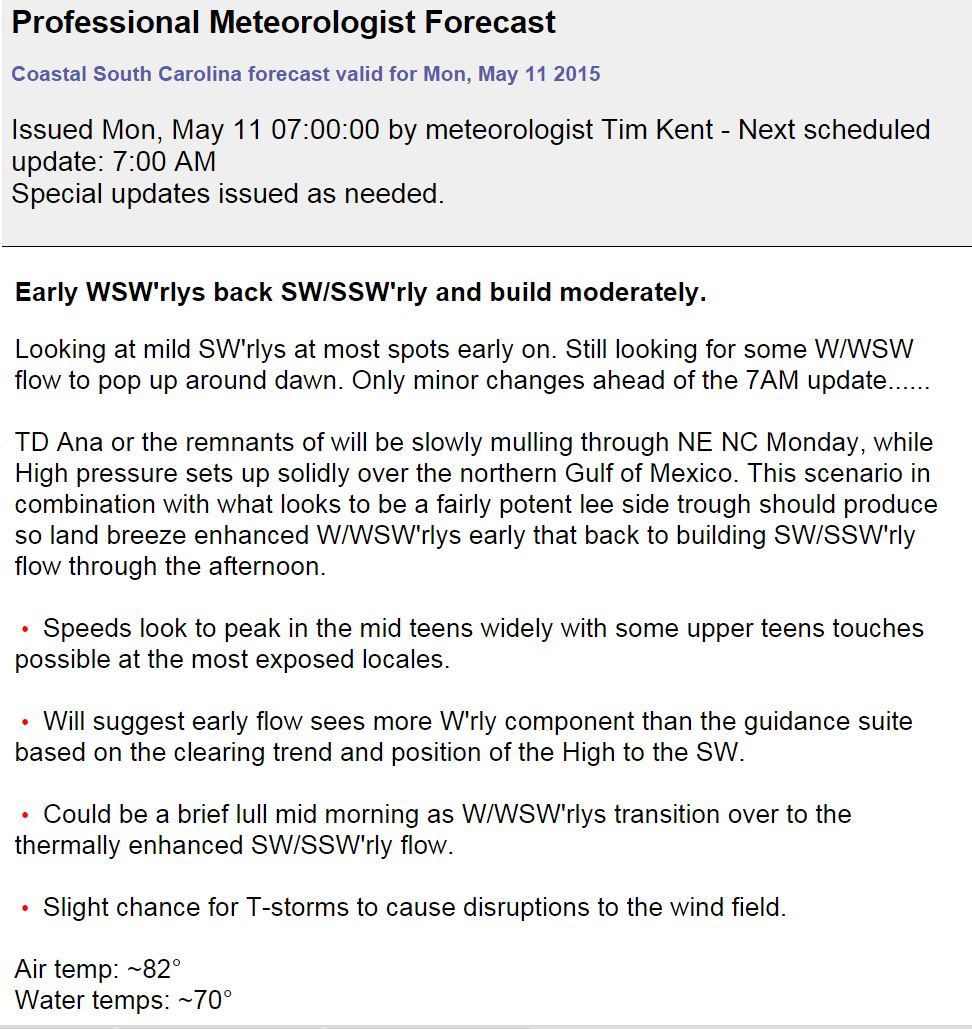
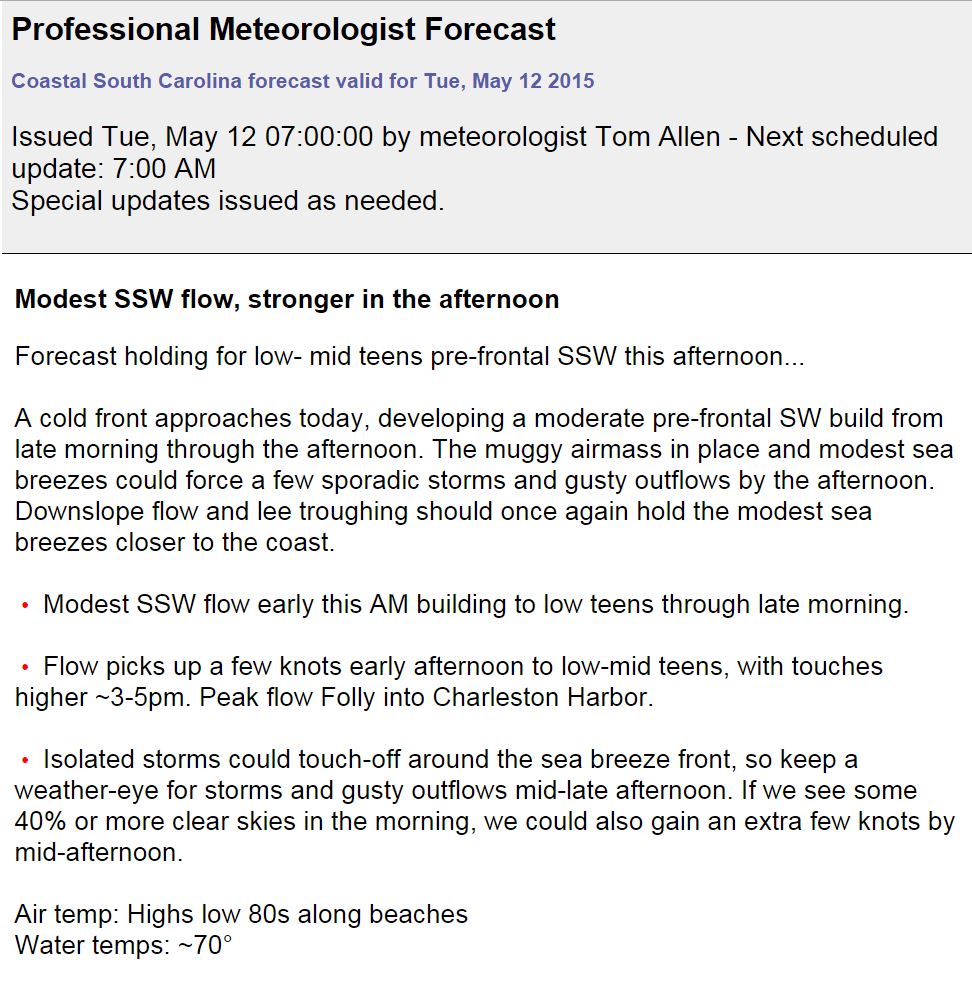
Forecast for the day by WeatherFlow meteorologist Dr. Tom Allen – good mentions of muggy air mass and talk about Sea Breeze storm potentials:
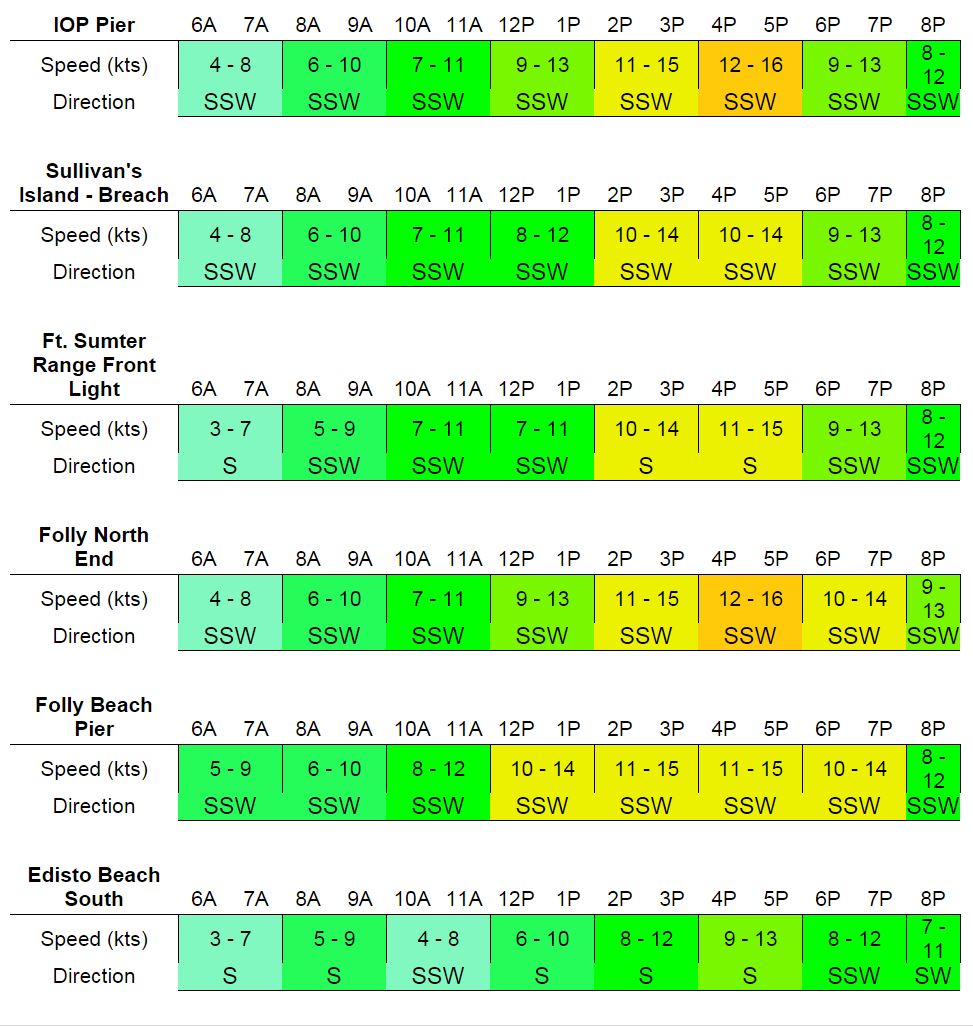
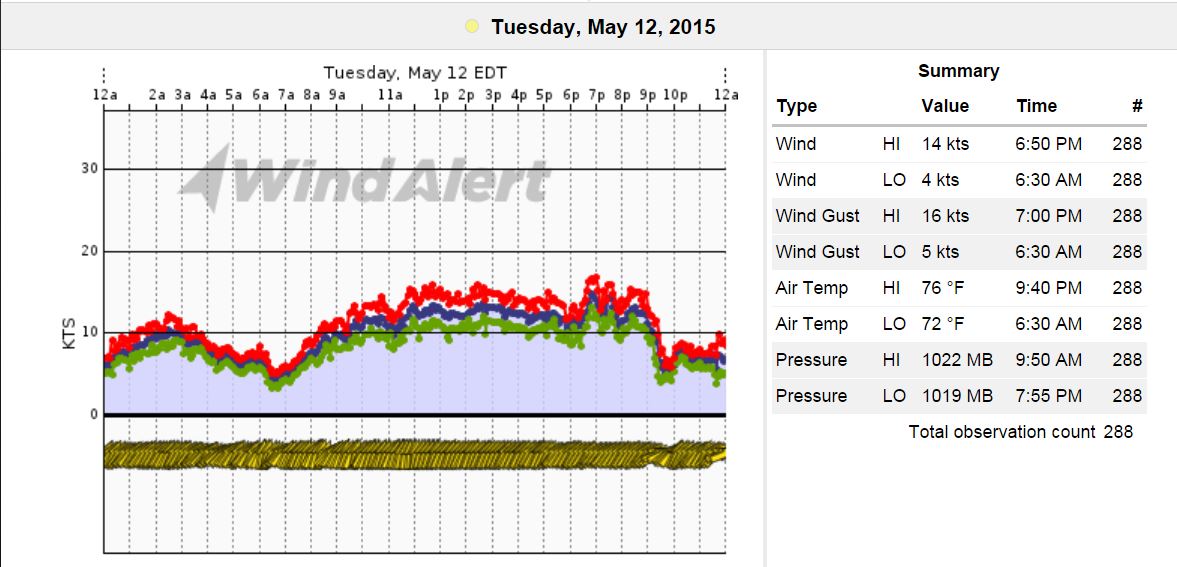
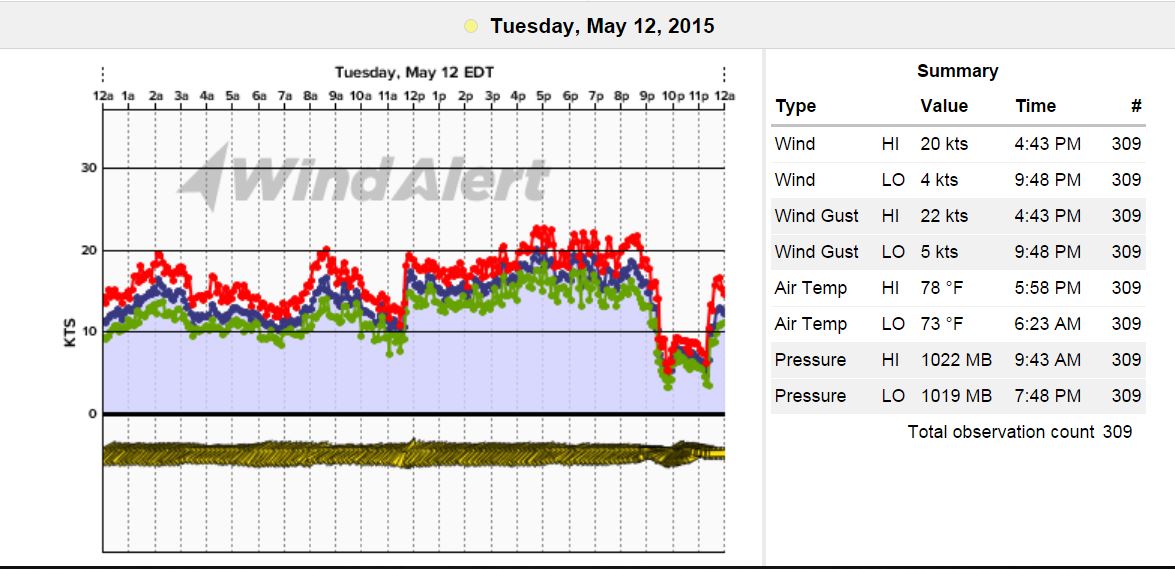
Graph from IOP Pier – another win for our mets team! Notice the bump up in speeds in the evening as the cold front closed in and inland thunderstorms sparked several extra knots.
Graph from the Charleston Harbor (Fort Sumter Front Range Light) – higher values as low level jetting, circulations and escape from mild marine layering helped the build. Always gotta watch that harbor – very tricky spot as heated land masses to the SW provide hotter dryer air and aid greatly in the surface mix.
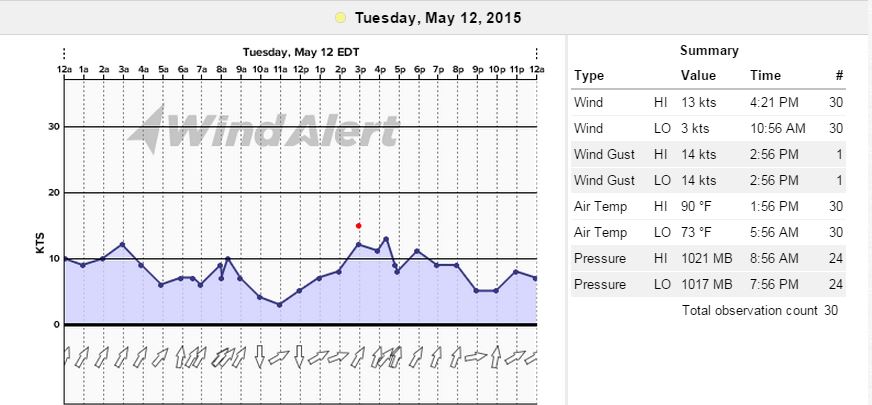
Charleston International Airport for inland comparison – notice the air temp differences again with a bit less effect and a jump in wind speeds during approaching convective activity in the evening around 6:30-7pm for the beaches:
Charleston Intl stats:
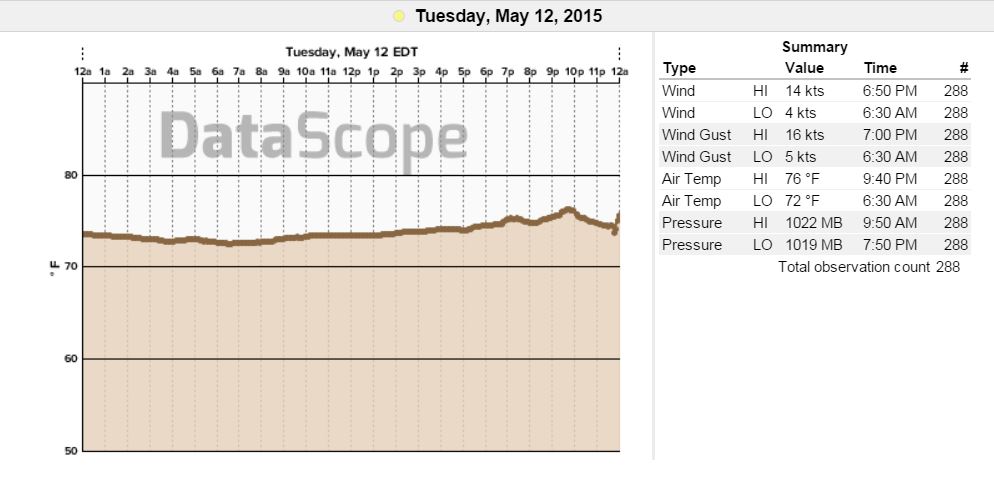
IOP air temps:
CHS Intl Airport air temps- gives you somewhat of an idea of the urban heating effects in the industrial/heavy industrial zone of North Charleston:
Here are the radar loops from the day where you can see more of a west to east progression -and an afternoon flare up of storming just west of Charleston:
(Notice the outflow boundary collision in the evening as the front closed in on the coast)

And last but not least…the Skew T for the 7pm sounding. The mid and upper level Westerly flow aloft is pushing 25-30kts at this point.
More on the outflow boundary collision here – and this is pretty neat!
https://blog.weatherflow.com/battle-of-the-outflow-boundaries/
Here are a couple more schematics of the Sea Breeze front and what is occurring at the leading edge:
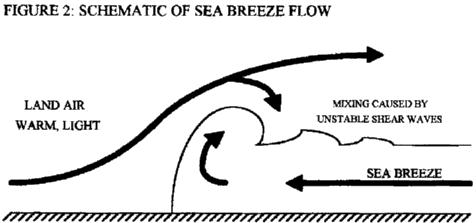
THEORY: Based on the thermal cap inversions so very common here in the mornings, it seems there is a sub-circulation going on underneath these caps in the morning hours as the Sea Breeze front drifts ashore and slowly makes it its way inland. The thinner the layer, the weaker the flow. As the cap lifts the flow widens and increases. This explains the jumps in the mid-morning hours we see at times just at the edge of the front (lifting winds) that calm down upon its passage and slowly build back up upon cool air advecting back down from the outflows. Eventually land heats to a point where the cap breaks – lifting and mixing occur with additional outflow fueling the Sea Breeze – which makes the full wheel of building winds. A tighter gradient over the coast from inland troughing and rapid heating helps to get this outflow going much earlier in the day.
More to come on the SC/GA/SENC Sea Breezes as we get into the hotter months.
Cheers,
WeatherFlow Meteorologist Team.
Sources:
Skew T’s provided by: NOAA http://www.spc.noaa.gov/exper/soundings/
Radar loops provided by: National Center for Atmospheric Research – http://weather.rap.ucar.edu/
CAPE table provided by: Meteorologist Jeff Haby http://www.theweatherprediction.com/habyhints/305/
Jet Stream archives provided by: http://squall.sfsu.edu/crws/archive/jetstream_archive.html
SPC Mesoscale Analysis pages for editing: http://www.spc.noaa.gov/exper/mesoanalysis/new/viewsector.php?sector=17
Surface map pages for editing provided by WSI via Intellicast.com