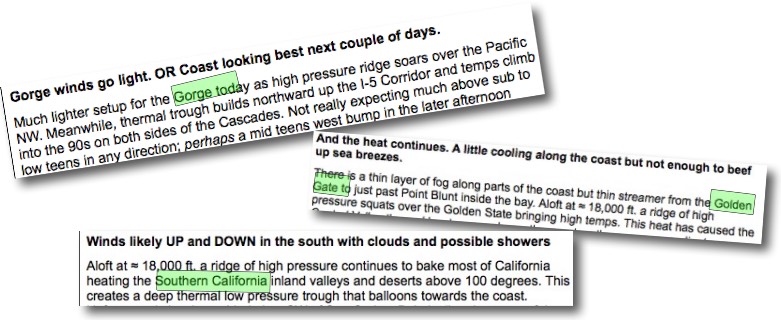
 Heat producing upper ridge causes surface thermal trough to expand over all 3 venues weakening wind.
by Mike Godsey
Take a look at today’s forecast for Southern California, The Gorge and the Bay Area. All three have HEAT as the common thread and all three have many sites where the wind will be weak. How can 3 venues separated by over 1000 miles have such similar weather? To understand the reason we have to look way aloft at the machinery that controls our surface winds.
 We make much about the surface winds that drive sails and kite in Southern California, the Bay Area and the Gorge but weather patterns that drive those surface winds are actually mostly up at ≈ 18,000 ft. where the upper ridges and upper troughs dwell.
In the first animation we are looking down at the North Pole and looking at the SURFACE winds. First find the Gorge and the Bay Area. Note how the North Pacific High which seems so huge off the west coast is actually a small time player on a global scale.
Also notice how the North Pacific High’s surface winds are focused on the Oregon coast but are a good ways from shore off of the Bay Area and Southern California. Also notice the winds that seem so strong in your kite or sail are actually fairly weak except near storms and hurricanes.
The obvious question is why don’t those winds from the North Pacific High jazz up the Gorge, Bay Area and Southern California winds today since they are at or near the coast. To answer that question and the intertwined heat question we have to look aloft and talk about the upper troughs and upper ridges you hear mentioned so often in the forecasts.
Upper troughs are southward extending loop in the upper level wind created as cooler air from the arctic pushes southward bringing cooler air, clouds and deepening the marine layer.
Upper ridges are areas where warmer air from the equator pushes northward bringing warming, clearer skies and compressing the marine layer.
These upper troughs and upper ridges travel slowly around world mostly from west to east. At any give time there averages 5-7 of these loops of winds. Looking at the second animation you can see these upper troughs and upper ridges in the northern hemisphere. Note how much stronger the winds are at this level compared to the surface winds.
Now look carefully at the 2nd animation and notice the upper ridge over the west coast of the USA. This creates a huge dome of high pressure air that is descending, compressing and heating over California and the Pacific  Northwest. All this heating in the Columbia Basin and California’s Central Valley and the Southern California deserts and inland valleys creates a SURFACE low pressure. As the day progresses this surface thermal trough (aka “heat bubble”) expands westward towards the coast. As it comes over the launch sites you have low pressure both in the interior AND over Gorge, Bay Area and Southern California coast. This of course means that the pressure gradient is near zero in the AM.
In the Gorge this typically entirely kills the wind during a heat wave except at sites at or closer to the cooling effects of the ocean ie. Jones Beach.
In Southern California the heat bubble typically comes over most of the sites in the Long Beach area so Belmont to Seal become unreliable as the pressure gradient fades. While Cabrillo is more protected from the heat bubble since it is on a Peninsula surrounded by cooler waters.
In the Bay Area this expansion of the Central Valley thermal low kills sites like Sherman Island and may cover the East Bay making sites like Pt. Isabel and Berkeley very iffy. However sites closer to the pacific may still blow. Why?
These sites are at or very close to the cooling waters of the Pacific. In the afternoon as the angle of the sun decreases the heating begins to slow in the interior. This causes the thermal low pressure at the surface to begin retract inland so the is a modest pressure gradient over sites nearest the coast.