By WeatherFlow meteorologist Shea Gibson 7/19/2020
Well here we are in the middle of July with several areas of the Atlantic basin warming up to optimal sea surface temperatures that support tropical cyclone development. The magic number for tropical cyclone development is not exact, but is generally pinned right around 26°C or 78.8°F or above. Currently, we are seeing SST’s in the mid to upper 80’s across the Gulf of Mexico and Caribbean, mid to upper 80’s along the SE coast…and warming up into the low to mid 80’s across the MDR (main development region). The MDR is the equatorial Atlantic that stretches from Africa to the Windward/Lee Islands of the Caribbean, and is where tropical waves off Africa will start showing up soon.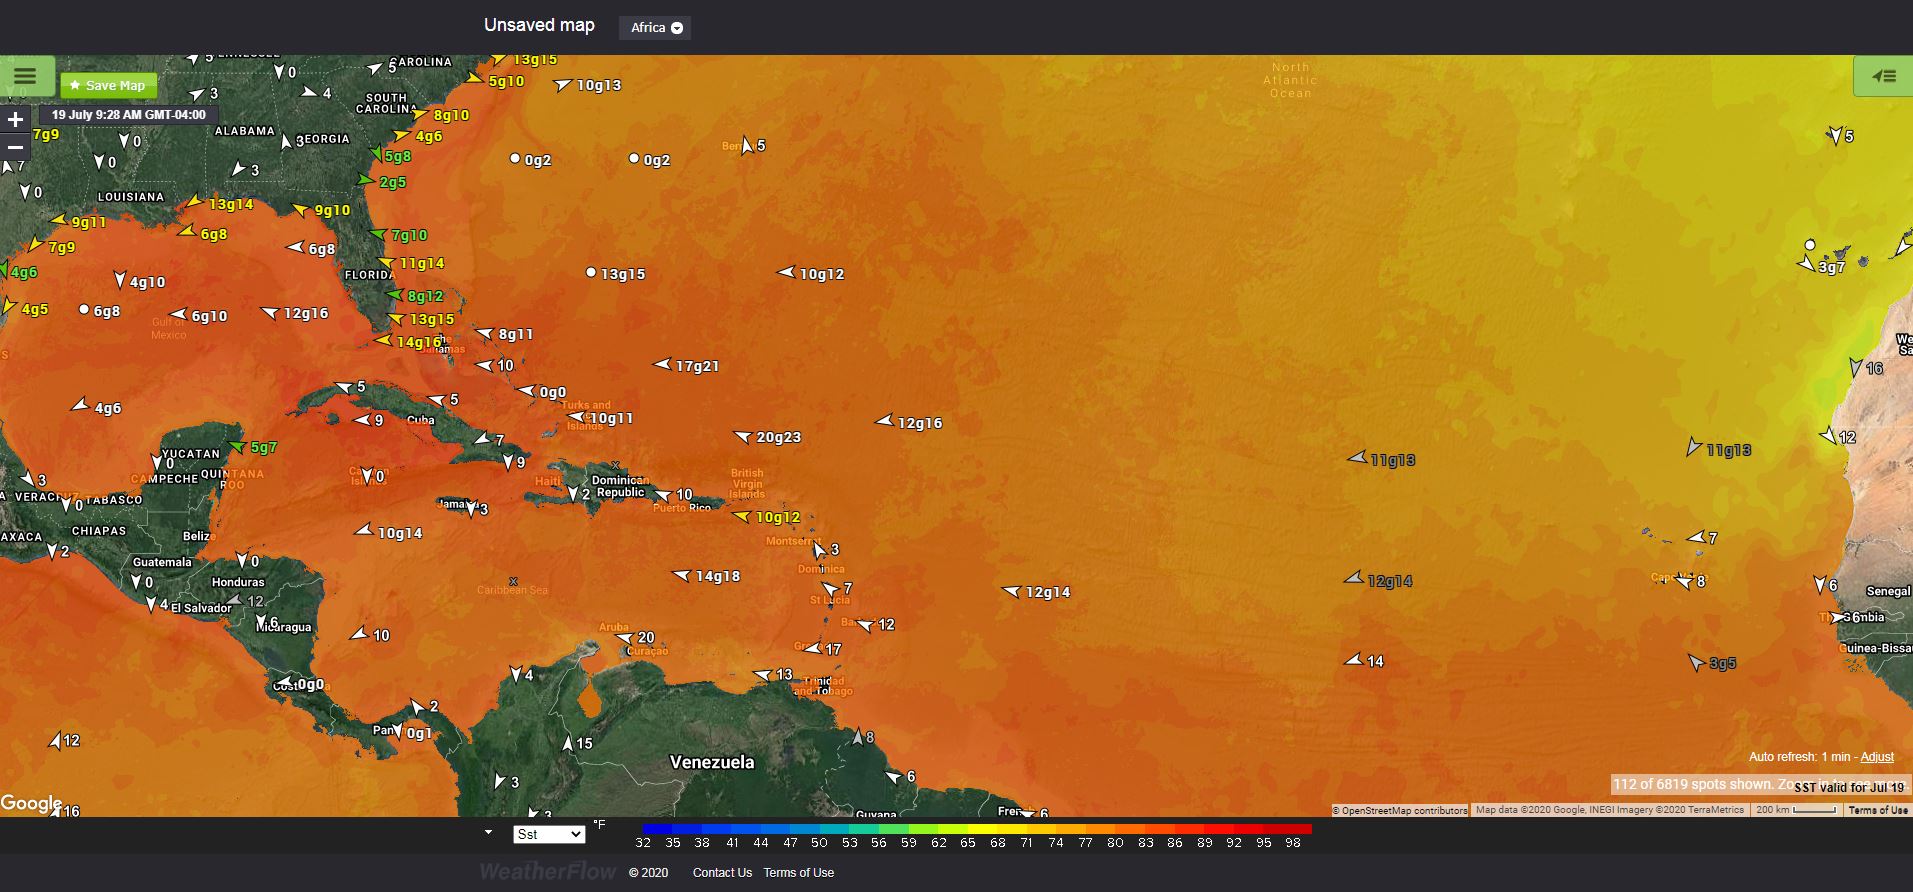
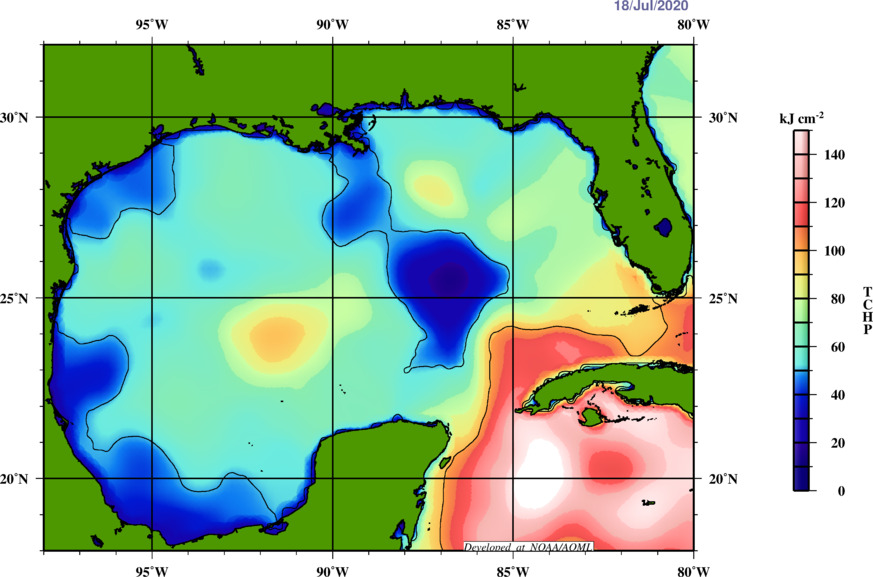
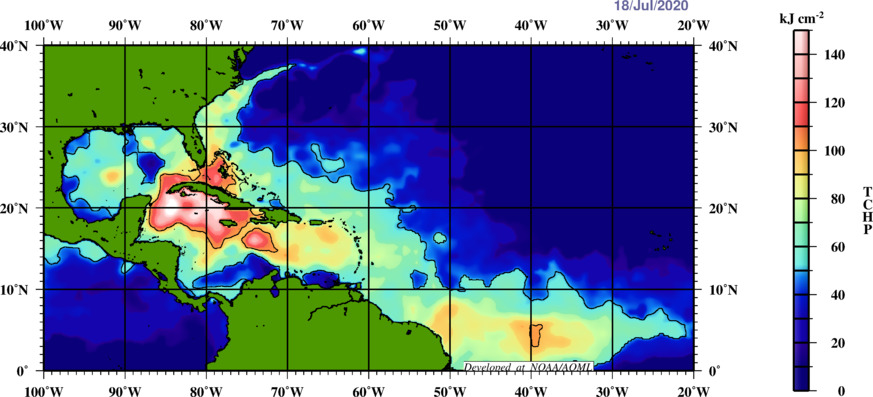
Also measured for TC development is what is called TCHP (tropical cyclone heat potential), which measures SST + depth of warm layer to determine how strong a TC could become if passing over the higher concentrated. The deeper the warm layer, the more fuel for maintaining or strengthening….and less cool water up-welling that the storm could produce to limit its capacity. Here is an example of NOAA’s current TCHP for the Gulf of Mexico, which is measured in kilojules per centimeter squared. Generally, we look for areas larger than 90 kJ cm-2 as the hot spots, but shallower waters (coastal shelf water for e.g. can create anomalies such as Hurricane Harvey 2017 in the TX Bight, which was only 35kJ/cm2). Notice how hot the Caribbean is – this is actually normal for this time of the year and we do see storms develop over or intensify in that area of the Atlantic basin.
And the Atlantic basin as a whole:
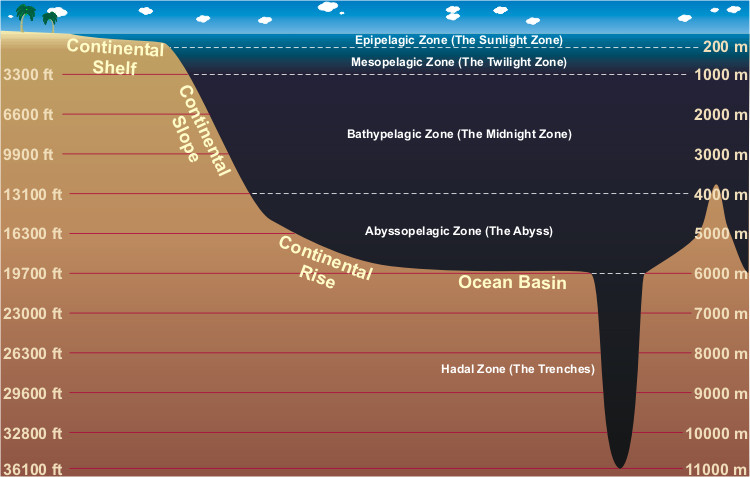
We usually tend to focus on the 26C (or warmer) isotherm, which is a depth of water that measures the same temperature through the vertical division(s), whether it be in the epipelagic zone (surface to 200m) or even tapping as far down as the mesopelagic zone (200m-1000m) in some less frequent cases.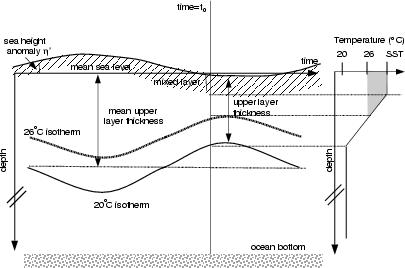
As a rule of thumb, the deeper and warmer the layer, the more strength a TC could gain. Rapid intensification can also occur as a result of a TC tapping into these warm, rich waters as a fueling mechanism (of course with all other atmospheric criteria being met). Lots of ongoing studies are still occurring, but with more data comes better decisions! That’s the WeatherFlow motto. 🙂
Here are links to NOAA on TCHP methodology and latest data maps:
https://www.aoml.noaa.gov/phod/cyclone/data/method.php
https://www.aoml.noaa.gov/phod/cyclone/data/
Keep up with watching SST’s in our apps and products to see what potentials exists in your area if the threat of a TC is there…or just to know for your own education.
Stay safe and always stay weather aware!
Shea Gibson
WeatherFlow Meteorologist/Wind Forecaster
SE Region / East Coast / Tropics
New Stations Projects & Outreach
Twitter: @WeatherFlowCHAS
Facebook: https://www.facebook.com/WeatherFlowCHAS/
Sources: NOAA (as linked above), OER Services https://courses.lumenlearning.com/suny-geophysical/chapter/layers-of-the-ocean/,