 Calm Gorge Winds, Sparse Bay winds and Strong Southern California coast winds. And what about Hurricane Harvey?
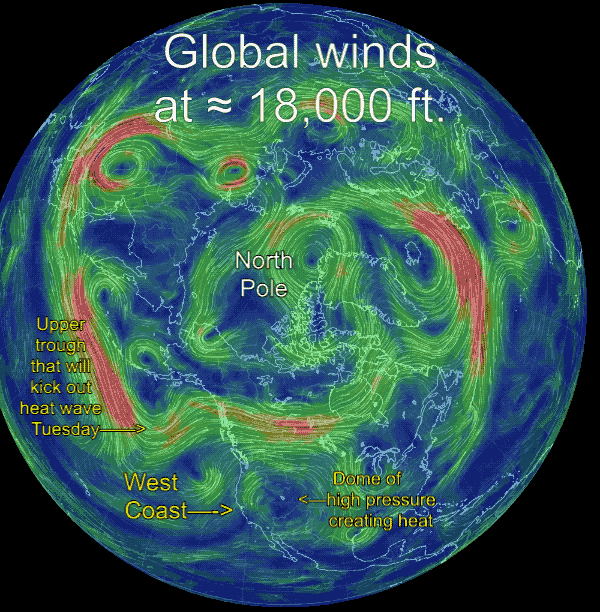
by Mike Godsey
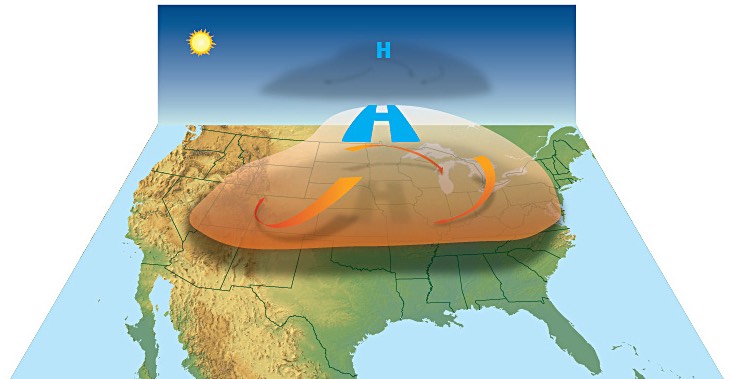
You have probably seen graphics like the one above from the Portland Press Herald during a heat wave. This is a very simplified depiction of the type of dome of upper high pressure that has been over the entire west coast the last couple of days.
So why does this dome bring on a heat wave, why does the heat linger and why does this have such a different impact on the winds in each region?
First let’s look at the big picture.
Here is the view of the northern hemisphere’s winds today at ≈ 18,000 ft. as depicted by the GFS model. Notice all the loops in the upper level winds. The southward dipping loops are called upper troughs while the northward loops are called upper ridges. These loops steer surface weather systems like the North Pacific High that create the wind at the surface. So a major key to forecasting surface winds is to track these upper events.
Now looking at the globe again find the USA’s west coast. Notice the upper ridge moving into Canada. Then notice the upper trough out in the Pacific (and my note about Tuesday.) 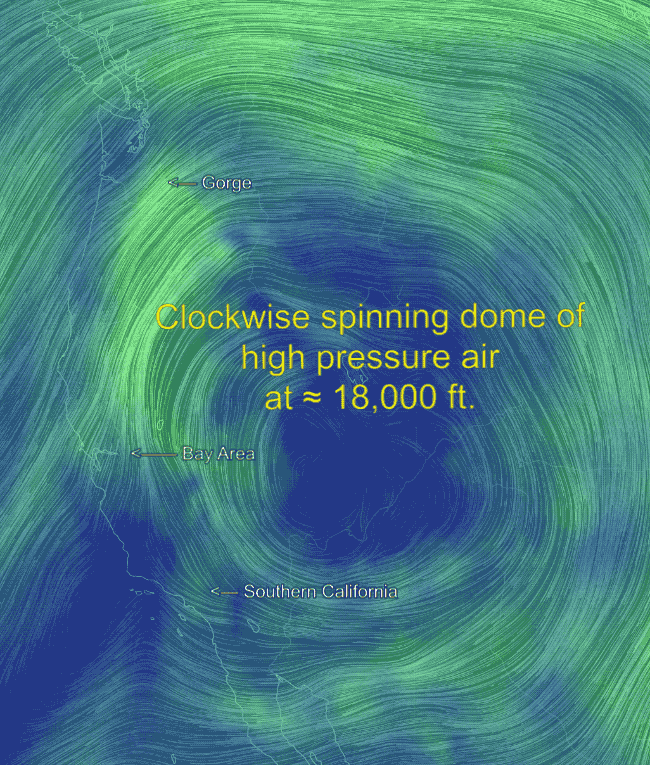 Most importantly notice the clockwise rotating mass of air at ≈ 18,000 ft. over the western USA. This is the heat producing dome of upper high pressure air.
Notice how the dome
seems cut off from the ribbon of upper level wind going around the globe. Once a high pressure is cut off like this it tends to linger since is not moved along the conveyer belt of wind that normally moves weather from W. to E across the USA.
Now look very carefully in the area of Texas and you can see the upper level winds over former Hurricane Harvey. Now can you figure out why the hurricane is modeled to linger over Texas for day with forecasts of up to 50 inches of rain?
Let’s take a closer look at the dome of high pressure. In this image you can see that the dome of high pressure is spinning clockwise over the western USA and covers the land from the Gorge to past Southern California.
The air within this spinning mass is subsiding or descending towards the surface.
As the air within the dome descends it heats up bringing on our heat wave as depicted in the next image. Why the spinning? Think back to the Coriolis effect you heard about between naps in high school.
All of this heating in the Columbia Basin, 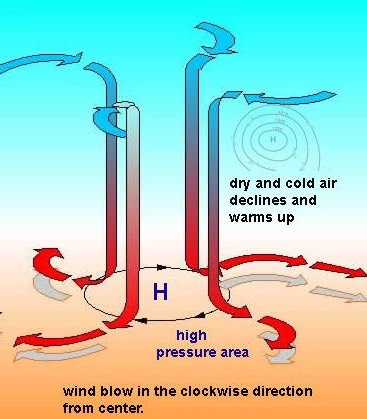 the Great Basin, the Central Valley and Willamette Valley causes the surface low pressure in those regions to expand. And with nearby mountains limiting the expansion means the low pressure has to bulge, following low elevation topography, towards the coast. As this happens it really changes location of the pressure gradients in the Gorge, the Bay Area and Southern California.
The easiest way to visualize the location of these valley low pressure 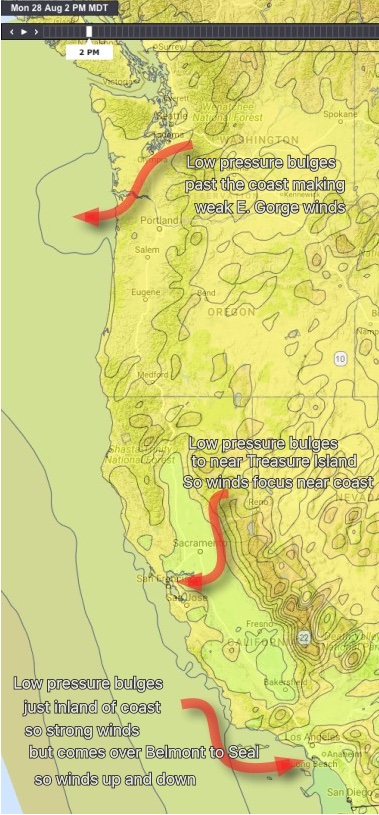 features is to look at the isobars. Isobars are lines of indicating where the air pressure is equal. By looking at the isobars extending from an area of low pressure when can see where the pressure gradient is strongest since the closer the lines are to each other the stronger the change in pressure and the stronger the wind.
So looking at this last image notice how low pressure from the Willamette Valley has expanded out into the Pacific with the tightest spacing of isobars in the Stevenson and Rooster Rock area. Hence we have been seeing weak E. winds in that zone.
The looking at the Bay Area check out the Central Valley thermal low in green and notice how its isobars are bulging into the Bay Area. Typically in a heat wave the low pressure expand over Sherman Island and the East Bay spoiling the pressure gradient. And often it even expands over the coast so the AM and early afternoon winds are limp. But often in the late afternoon the low pressure retreats inland a bit so sites near the coast see late mild wind.
Lastly look at Southern California. Note how the isobars expand right to the coast. This means there is a strong pressure gradient over the coast so Southern California typically sees solid winds during a heat wave. However if it gets too hot the isobars you see along the coast may wobble over Belmont to Seal making for up and down winds.
So when does the heat wave end and normal wind patterns return? Go back to the image of the globe above. See the upper trough west of the USAat ≈ 18,000 ft.? That structure will begin to hit the west coast Tuesday. It will first impact the Gorge Tuesday morning and deepen the marine layer and indirectly jacking up the pressure gradient. Later afternoon to evening onTuesday the same thing happens in the Bay Area. So is a bit more to the east so the change to cooler weather and a deeper marine layer will probably be felt Wednesday.