by Kate Looney with imagery by Kate Looney and Mike Godsey
The first major coastal storm of the fall season took shape over the Chesapeake Bay on October 16th with a swath of moderate to strong E/SE winds building ahead of the storm and a powerful W/SW blast shaping up on the backside of the system. Tens of thousands of people lost power and new surface low pressure records were set for October in several locations across Rhode Island, Massachusetts (including Boston), New Hampshire, and Maine (more on this later).
Let’s take a look at how the system evolved. 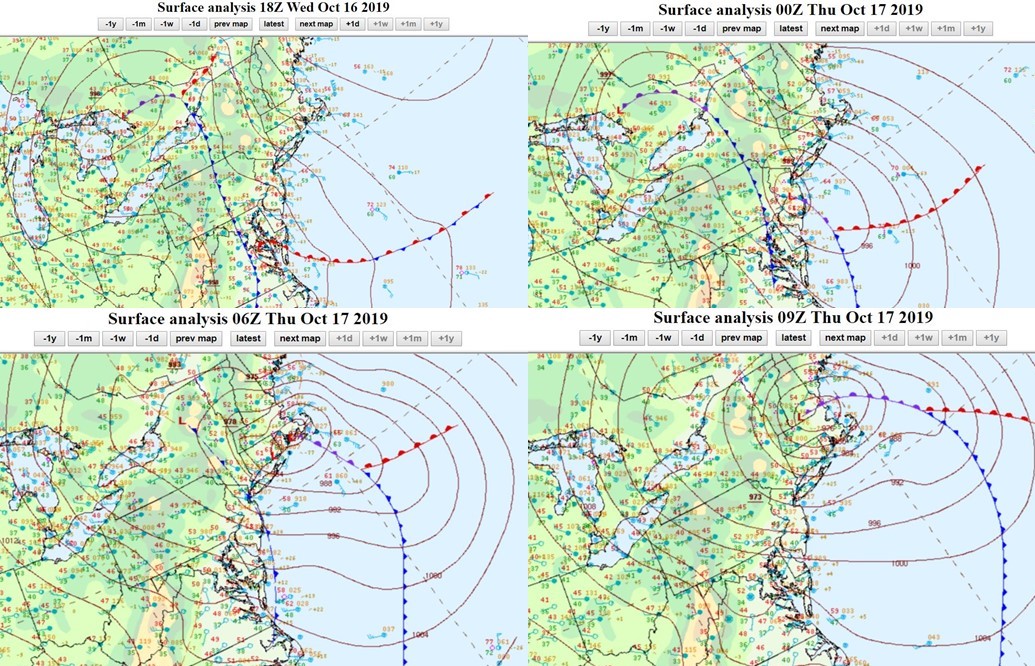
Looking at the surface analysis progression (courtesy of NOAA’s WPC), we see the beginning of a nice double-barreled low pressure system building at the surface at 2PM EDT the 16th across the Chesapeake Bay. This was in response to a splitting southern branch of the jet stream high above the surface (top left image).
By 00Z (8PM EDT, top right), the surface cold front has caught the warm front across the Delmarva region and a second occlusion has formed along the deepening coastal low. Moderate to strong SE to E winds were building from the Delmarva region all the way up into Massachusetts in response to the continued strengthening of this low.
The low continued tracking up the New Jersey coastline and up into the Rhode Island/Cape Cod area by 6Z (2AM EDT, bottom right) before rotating back northwestward just west of Boston as it rapidly “bombed out”, or strengthened quickly over a short period of time. The two different areas of surface low pressure eventually evolved into one exceptionally strong October surface low, hence the records set for minimum surface pressure.
Here’s a look at the water vapor imagery overlaid with surface pressure as the coastal low continues deepening from about 2AM EDT to 7:30 EDT the 17th:
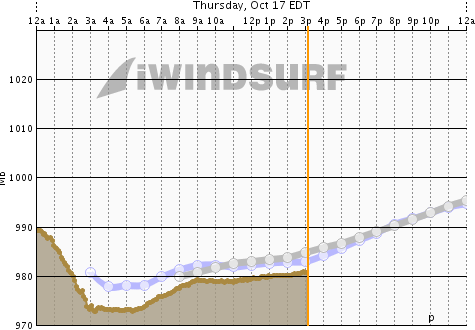
WeatherFlow’s Carson Beach sensor reported a surface low pressure of 973mb just after 3am local time on the 17th as the low passed between Boston and Worcester, Massachusetts.

As this low moved up west of Boston, the occlusion eventually began to choke the system. Eventually, the low slowed down and began to weaken across New Hampshire/southern Maine.
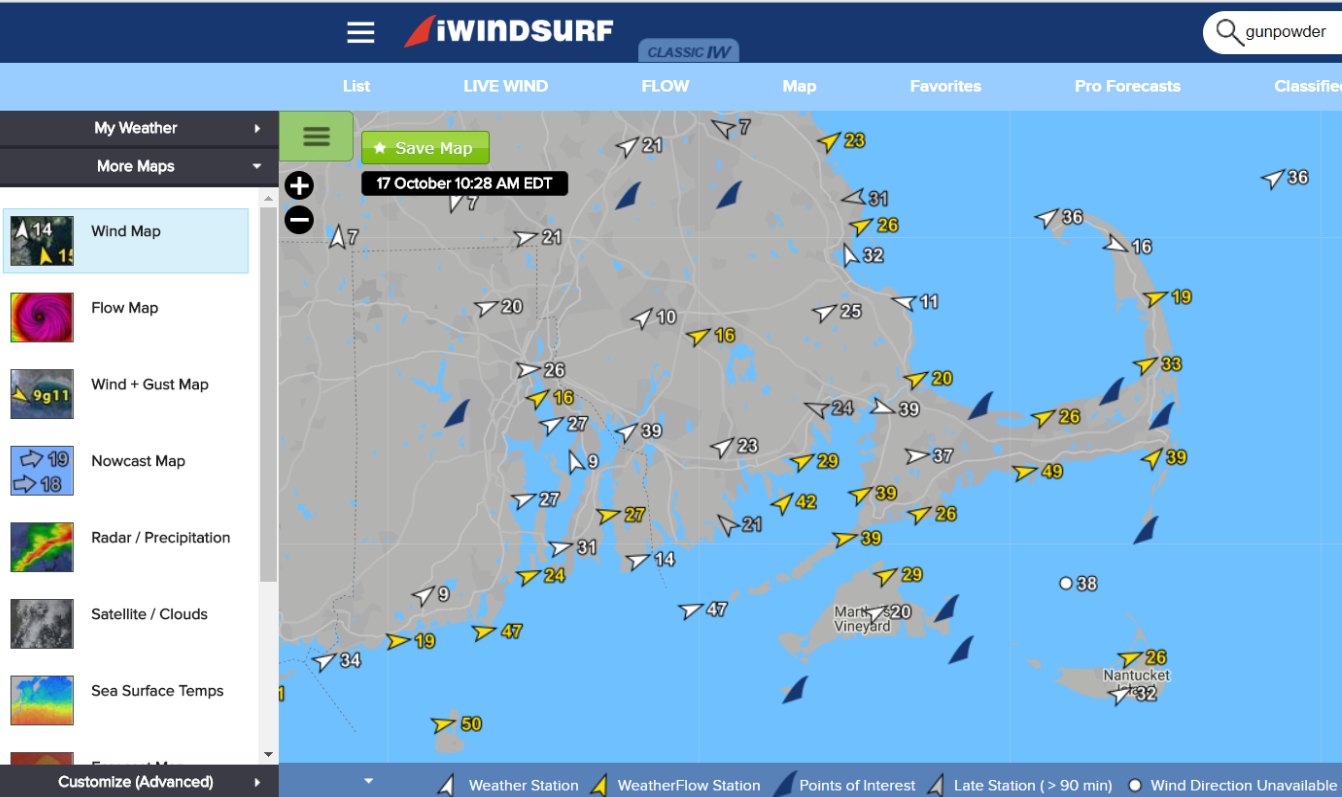
As a result, a large swath of very strong W to SW winds pummeled much of the Mid-Atlantic and especially the Northeast this morning, only finally easing up late this afternoon. The image below is an areal snapshot of WeatherFlow sensors across Rhode Island and Massachusetts about 10:30EDT with many sites maintaining near or above tropical storm force averages a good portion of the day and even stronger gusts well into the afternoon hours.
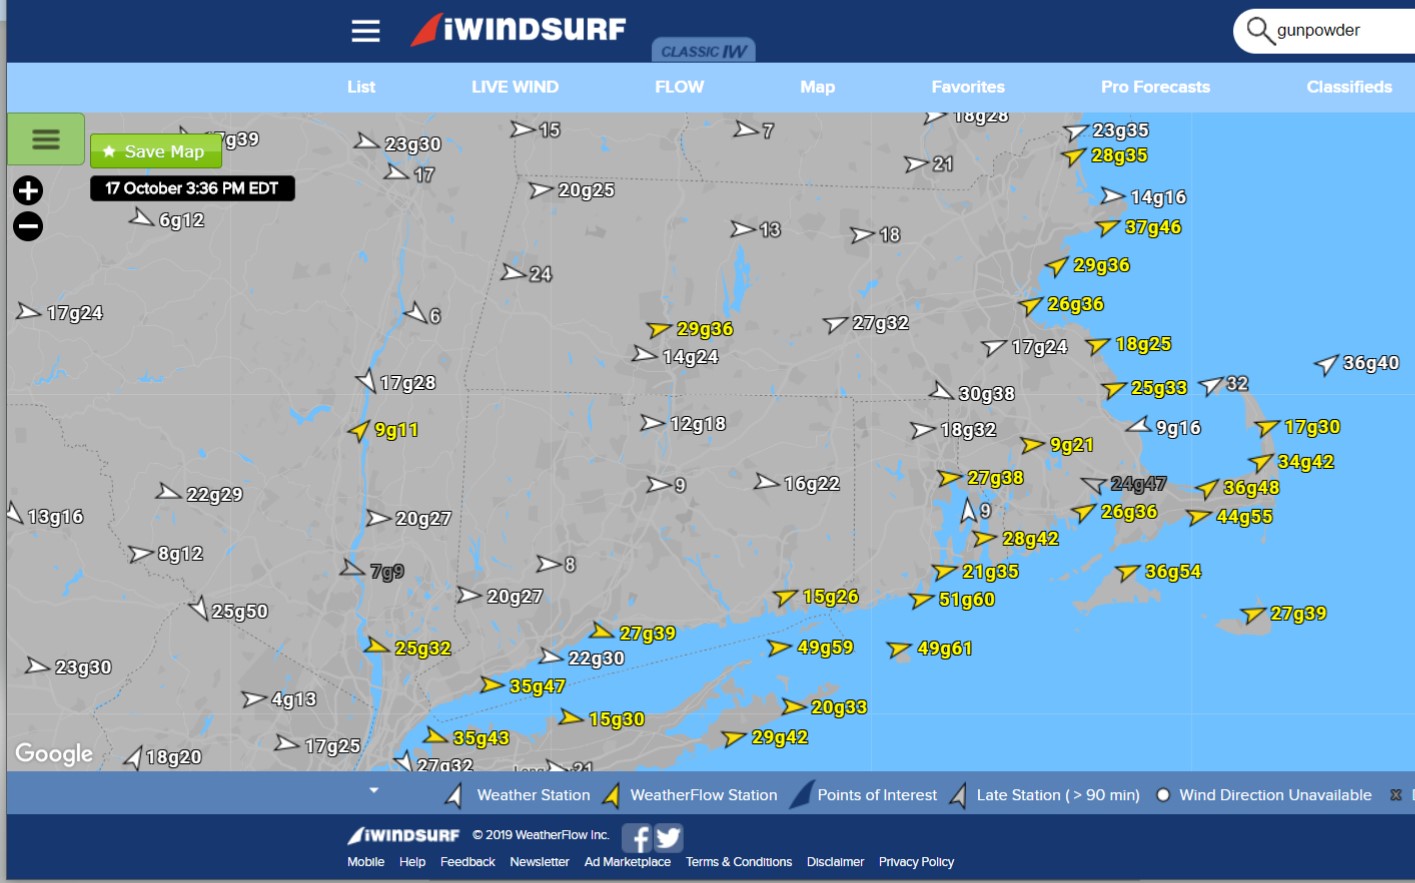
Another areal view of strong W/WSW winds with gusts noted as of 3:30 EDT. Notice the gusts into the 50s/60s through eastern Long Island Sound, coastal Rhode Island, and southern Cape Cod waters.
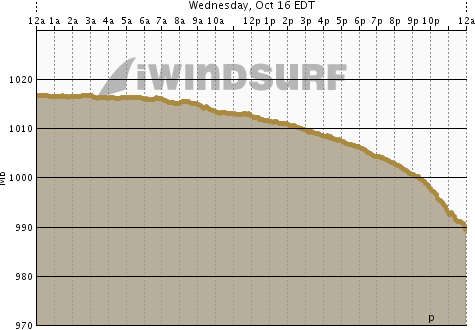
The images below show the dramatic drop in surface pressure from WeatherFlow’s Carson Beach sensor in the Boston area from Wednesday to Thursday, hence the meteorological distinction of a “bombing” low (greater than 24mb drop in 24 hour period):
WeatherFlow’s Flow Map product nicely shows the cyclonic spiraling of surface winds into this low overlaid with surface wind observations. The surface low tracked right across the Concord, New Hampshire area around 8AM EDT, which also set a new record October low pressure of 973mb pending NWS verification.
Also of note about this storm-this post has thus far avoided the term “Nor’Easter” in association with this system. Although it did maintain a northeastern track as coastal lows often do during the fall and winter seasons, a classic Nor’Easter is named because of the strong NE winds that develop ahead of the system across the Mid-Atlantic and Northeastern US. In this case, due to the track of the coastal low much closer in to the coastline, winds ahead of the system remained out of the SE to E. Really it’s a moot point though as no matter what you call it, it was definitely a record-setting system for October.
Bottom line, the track of the low plays a big role in how the wind field evolves for a very large area.
Because of the necessity in an accurate forecast track and it’s implications on the wind field, these systems can be quite tricky to forecast on days when adventurous sailors, surfers, and kiters may want to take advantage of strong winds. WeatherFlow meteorologists may include a statement like “forecast remains subject to change/highly dependent on track of the low/winds may drop quickly” to convey the uncertainty in these situations until a more clear track is known. Large swings in speed and direction can happen over the course of an hour or two for areas where the surface low passes overhead or close by, somewhat like the calmer winds in an eye of a hurricane.
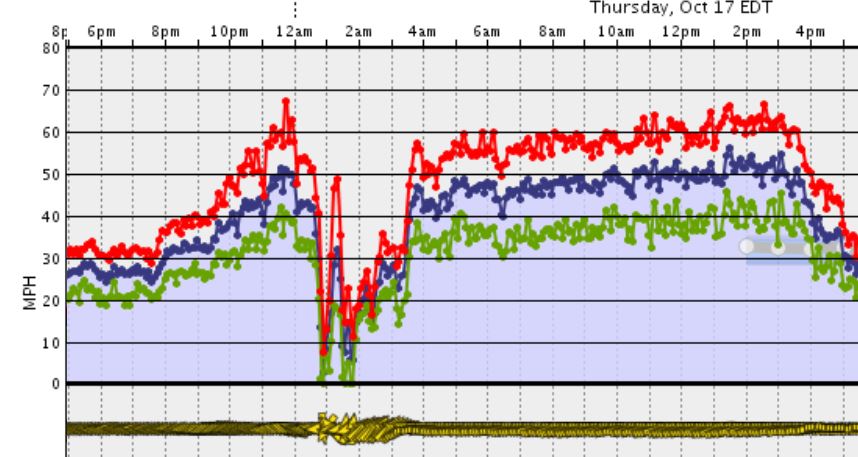
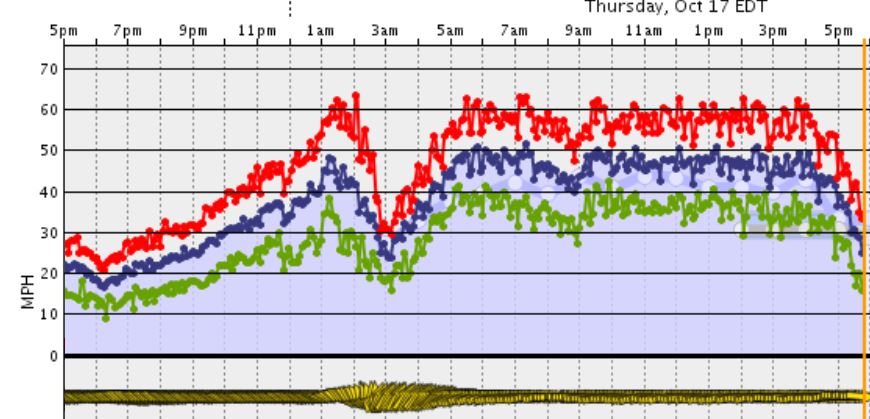
This image below from WeatherFlow’s Kalmus sensor in Cape Cod highlights the potential for rapid changes in winds: You can see around 1AM that winds begin to drop out to mid 20s briefly after building to nearly 50mph. This is followed by a steady build and almost 180 degree reversal in direction from ESE to WSW due to proximity of the surface low swinging by just the west. Quite the variety in speed/direction over a few hours!
A more dramatic example can be seen below at Weatherflow’s Pt. Judith, Rhode Island sensor, where winds went from 50mph to near 10mph in about an hour! Steady veering to the SW/WSW ensued with a quick build back to very strong upper 40s/low 50s with passage of the low.