Yesterday’s forecast was a tough one so I made sure to check back this evening to verify. We know we may not always be exactly right and so the process of verifying helps us to learn and improve and also to understand the eccentricities of each model. WeatherFlow has a suite of models to chose from, each having its own strengths and weaknesses.
As I looked through this event of strong NNW flow spilling over the mountains of Southern California it was interesting to see how each model responded. It became very clear how valuable a fine mesh model is when forecasting winds in this terrain.

Here is how the winds looked at 9pm. Belmont has seen over 30 knots for much of today while just a few miles west Cabrillo’s winds have been more northerly and lighter, in the upper teens to low 20s.
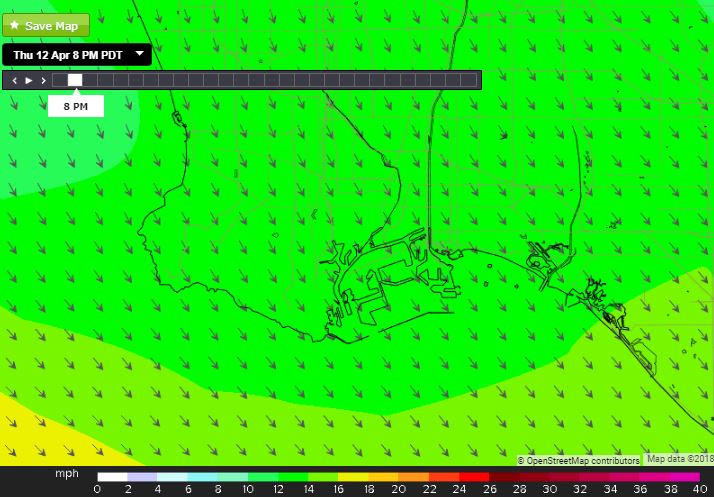
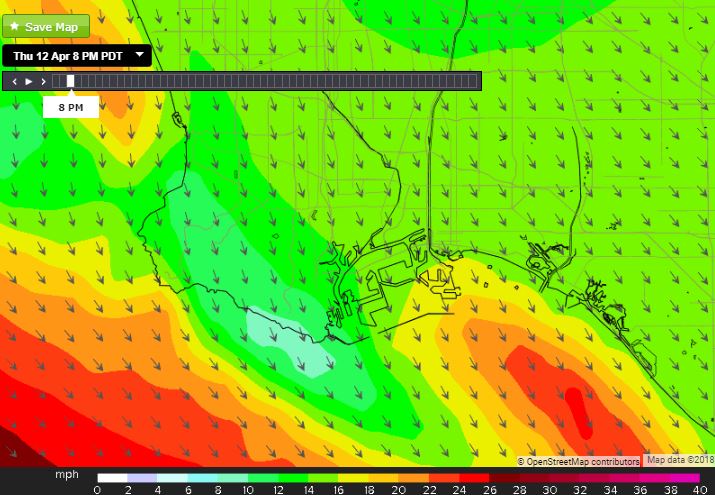
The map above shows the forecast for the Long Beach area as predicted by the North American Model using a 12 km grid while the map below shows the same model but using a 3 km grid. You can clearly see that the smaller grid is able to predict the strong winds that are created as the NNW flow pushes through the LA Basin and then offshore south of Cabrillo. However it is clear that the 30 knot winds for Belmont are not predicted.
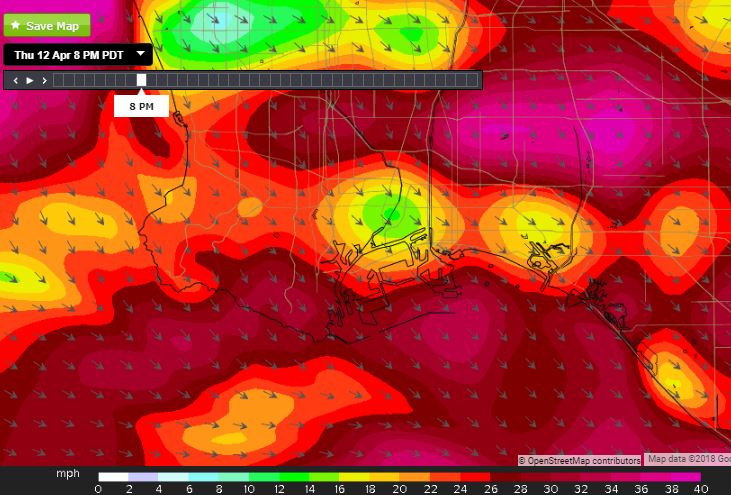
While the NAM 3 obviously did a much better job than it’s 12 km counterpart, it was interesting to see the output from WeatherFlow’s Wf-Wrf which was run on a 1km grid. The map below shows that this model picked up on the both the higher speeds and the wide variation due in large part to the higher resolution of the grid.