By WeatherFlow meteorologist Shea Gibson.
On November 1, 2014, we had quite a unique winter event occur in the SE Region. There have been quite a few anomalies in the weather this year pointing towards a stronger winter pattern in the south, with this event in particular sparking an unusual surge of cold arctic air and wintry precipitation into SC/GA.
A cold front was lining up to cut through the SE region and bring colder air behind it, which is a typical setup for the SE Region this time of year. Models were leaning towards combining of Lows offshore NC/VA and sliding north.
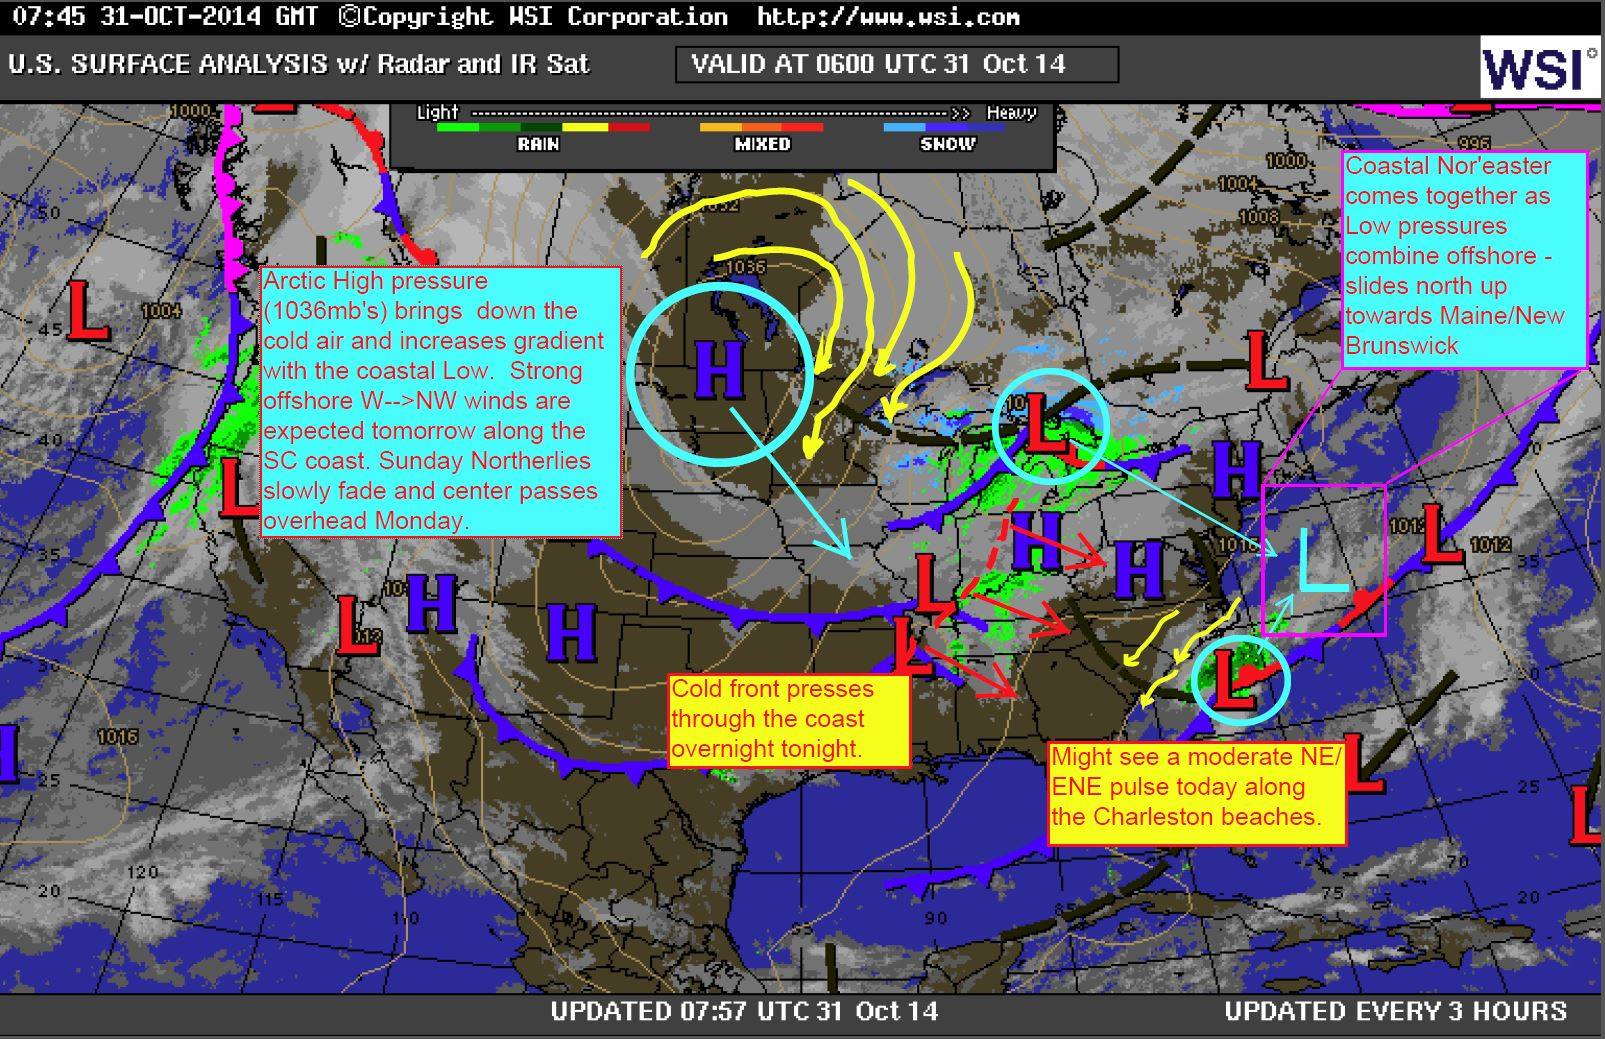
What the surface map looked like on November 1, 2014 at 0700 – Low pressures stayed separated and the one to the south dipped a bit further south than anticipated:

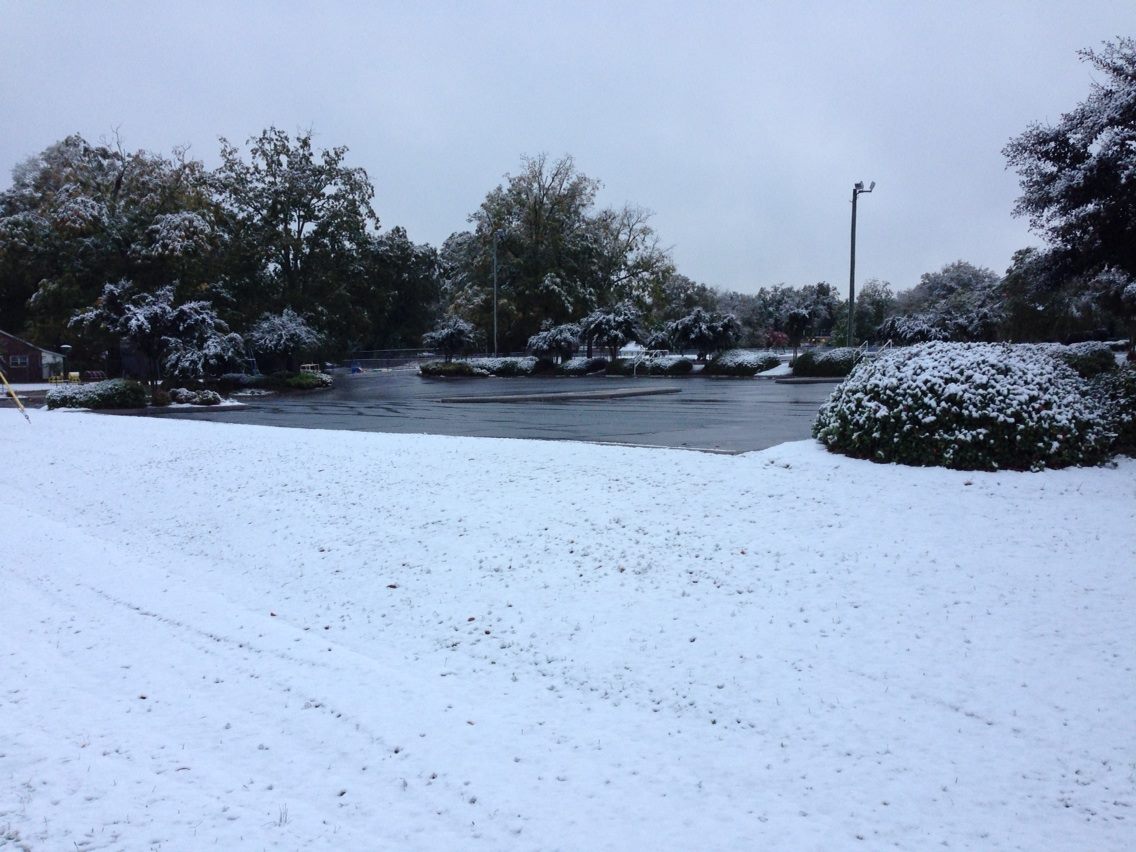
What happened was that Low pressures tracking along the boundary (they usually head up the boundary to the NE or East with the front) combined just before crossing the Appalachians. A stronger upper Low formed and instead of heading up the coast, it pulled down to the ESE and wrapped the colder air down and around behind it. With the abundance of cold air at the mid and upper levels, many locales with air temps in the mid/upper 30’s saw snow and sleet fall through the morning hours to many midlands locales from Columbia, SC down to Augusta, GA and even some flurries down along middle/southern coastal SC. Areas with freezing temps got as much a 2 inches of snow to stick. Hmmm. Do the quickly cooled Piedmont soil types have anything to do with these areas where wintry precip stuck? Air temps were in the mid 60’s the day before. Just a thought – perhaps a blog for another time.
Photo by Brad Dyar in Greenwood, SC, Nov 1, 2014.
The track of the Low was more of a downward arc as it headed towards the Atlantic and then peeled up the coast to join another coastal Low for a total Nor’easter event up north. Much of this movement was due to a major dip in the jet stream (Rossby wave). Here is the 300mb upper air pattern with a very sharp dip down into Florida:
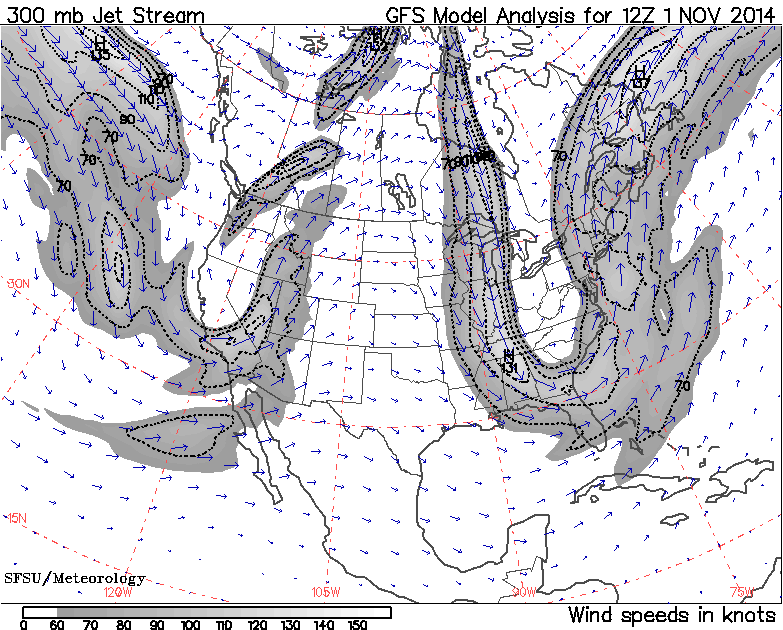
Here you can clearly see the track it took, beginning in the Tennessee/KY Valleys and swooping downslope across SC after crossing the Appalachians.
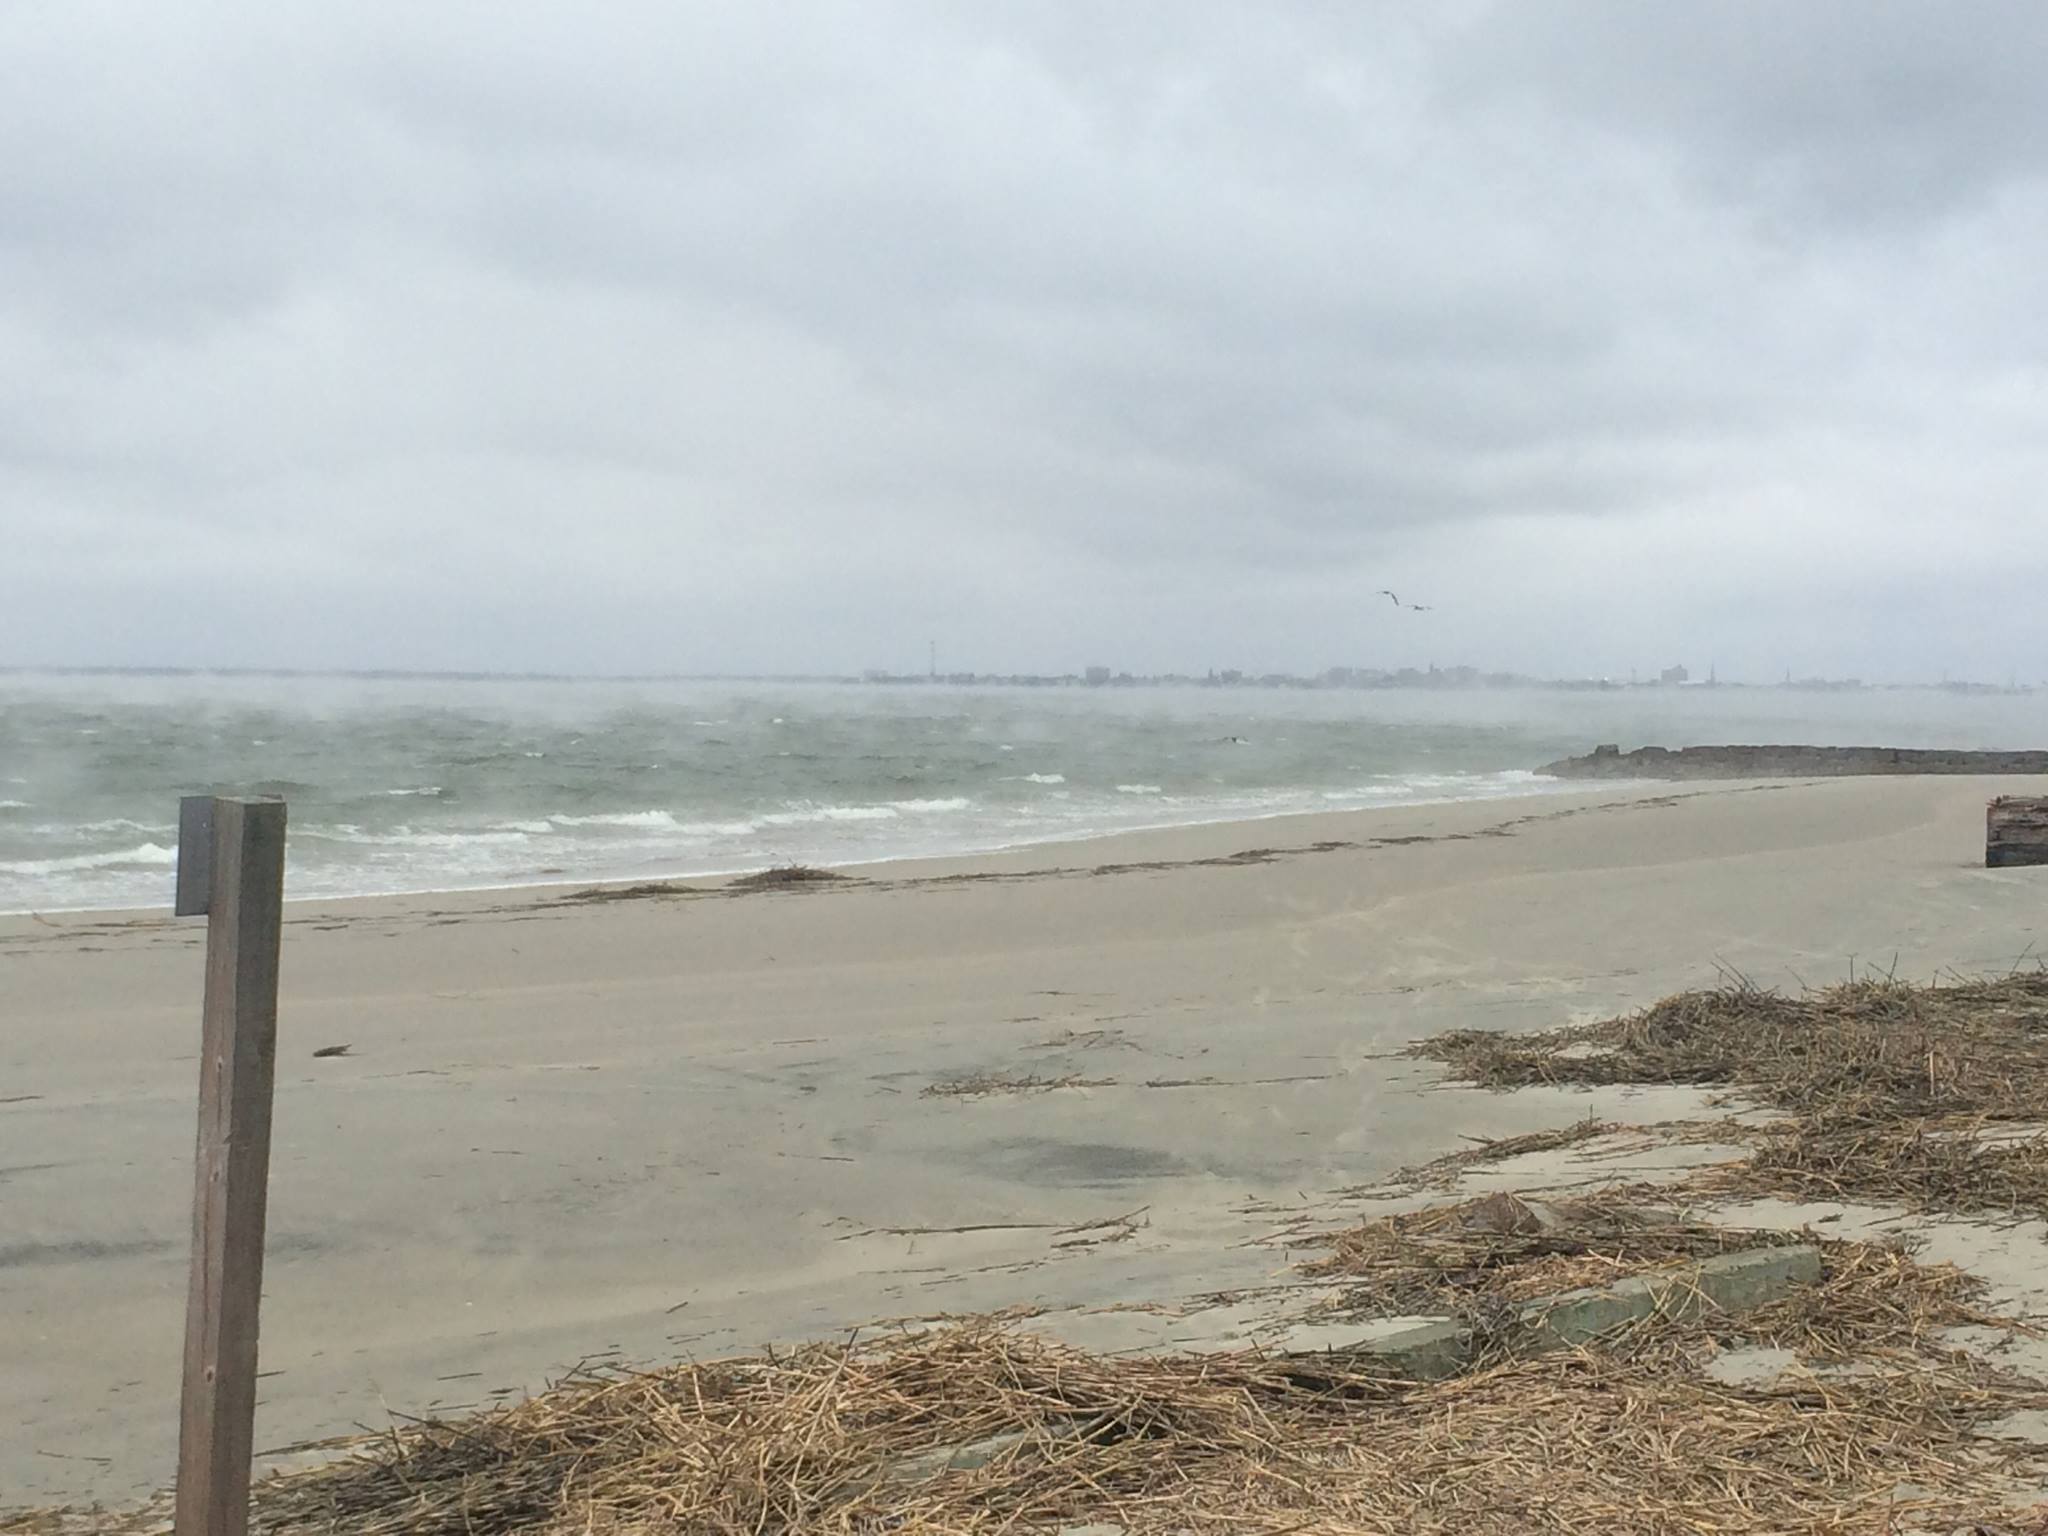
The cold air caused a visually unique and not-too-common event over our local waters – called Sea Smoke…also called evaporation fog or steam fog. When the cool air mixes with the warm moist air over the water, the moist air cools until its humidity reaches 100% and fog forms. This gives appearance of “wisps of smoke” rising off the surface of the water. Very impressive to watch. Pictures really don’t justify the visual experience, but you can see the effects.
Photo by Peter Maloney, Station 12, Sullivan’s Island, Charleston, SC, 11/1/14 (overlooking the Charleston Harbor)
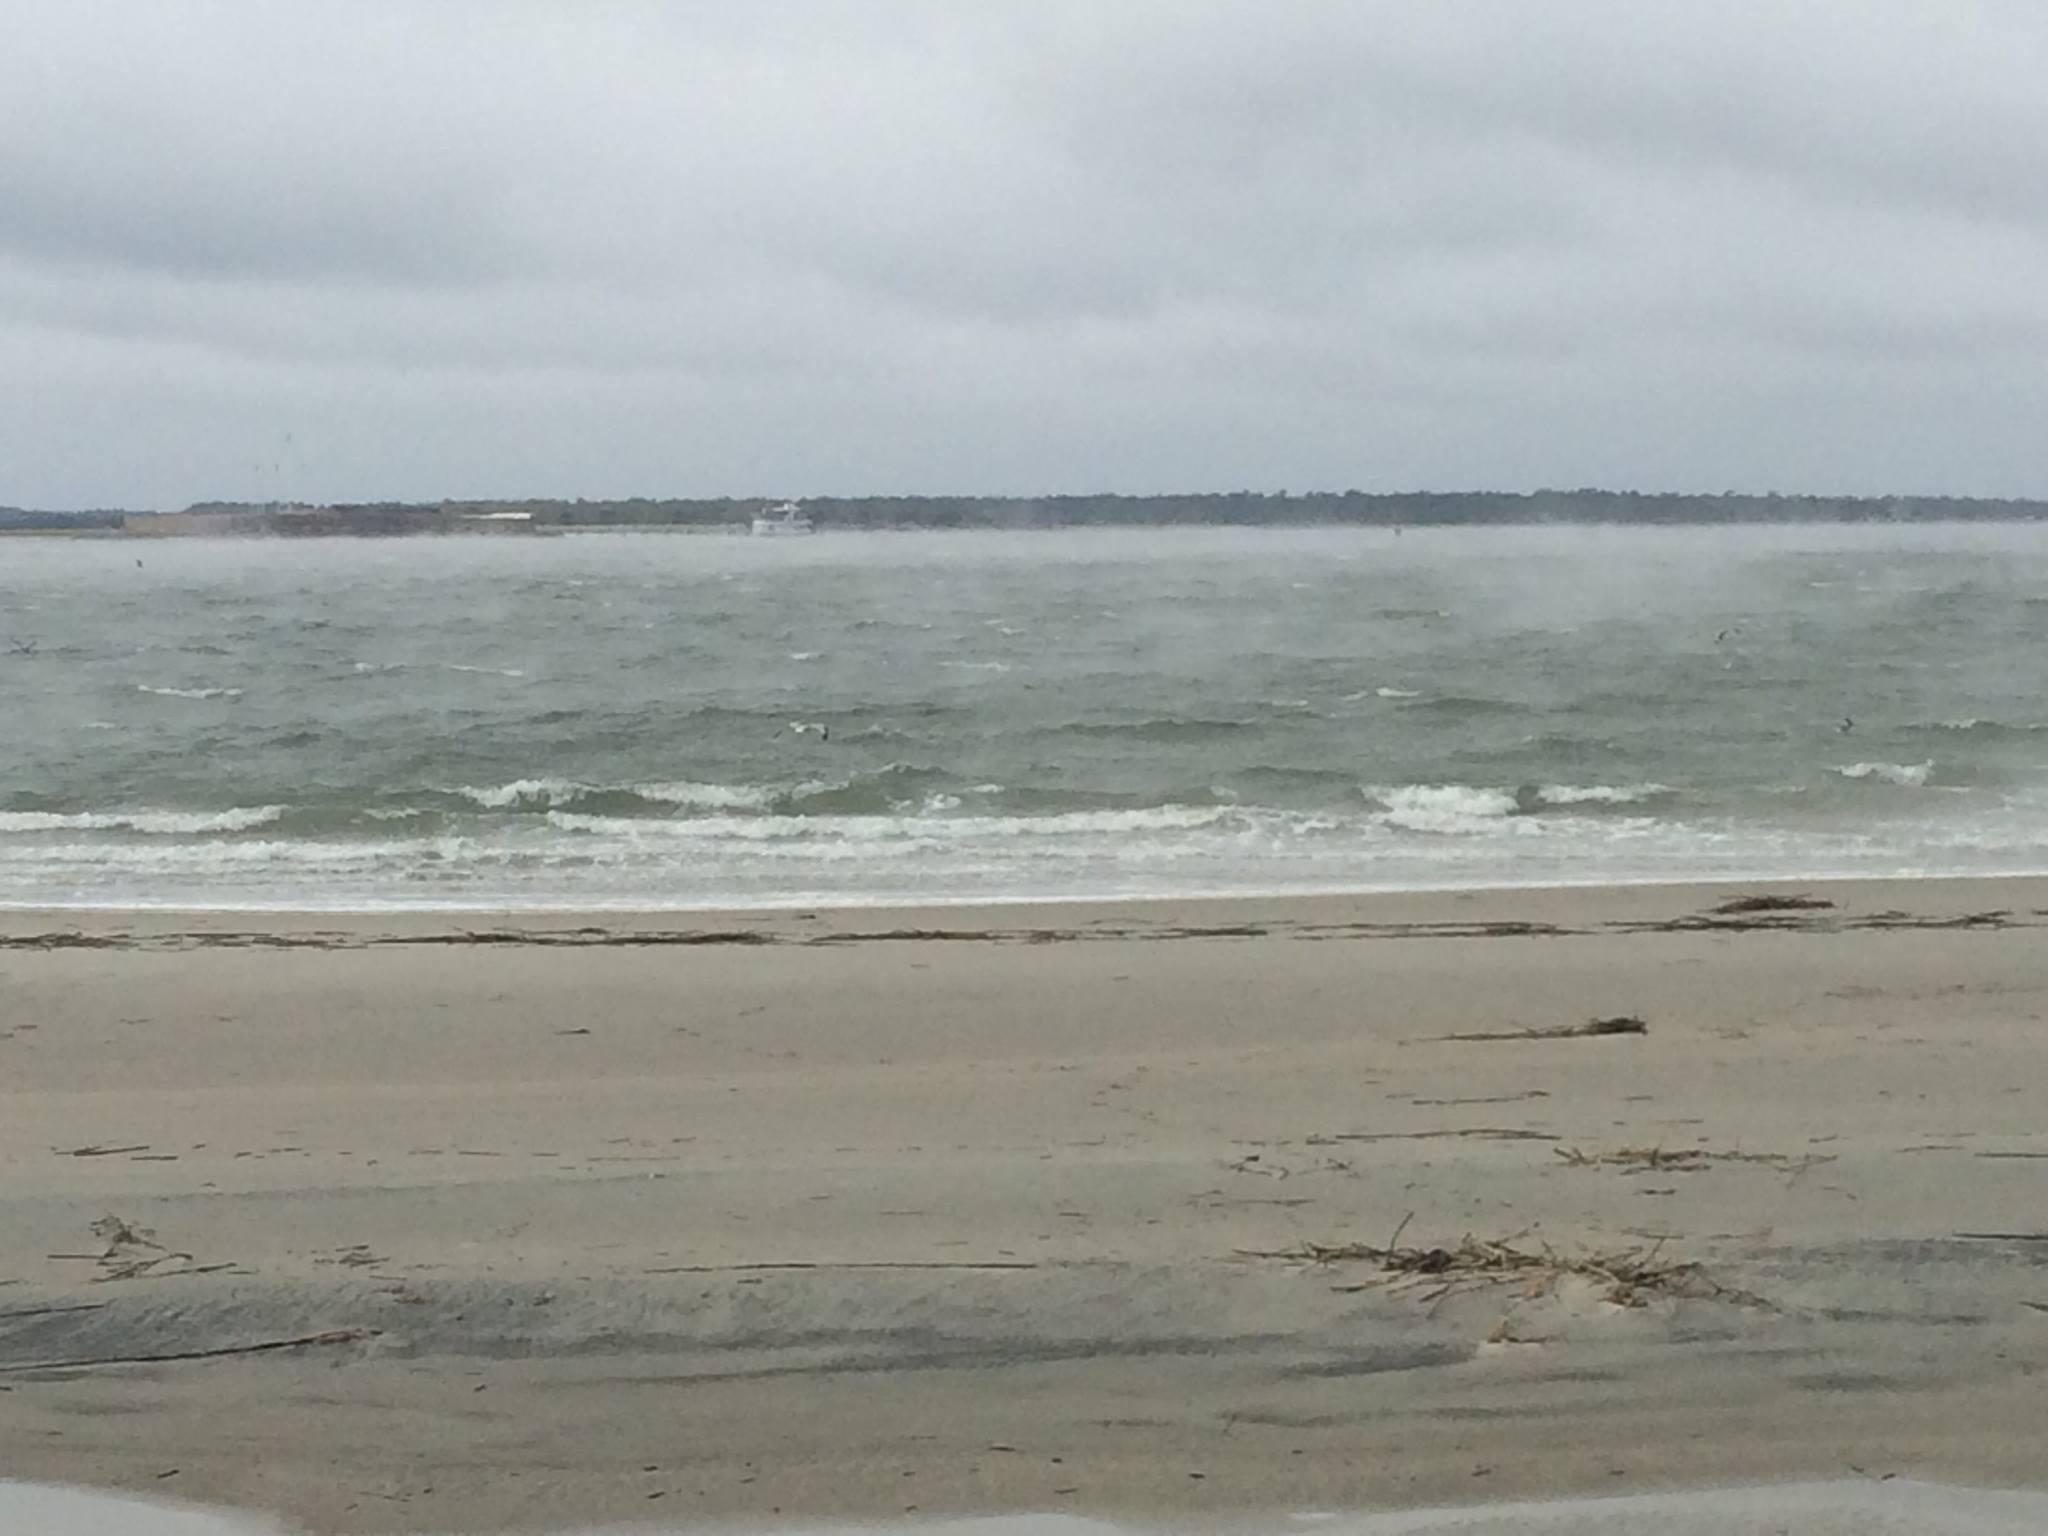
Photo by Peter Maloney, Station 12, Sullivan’s Island, Charleston, SC, 11/1/14 (overlooking the Charleston Harbor)
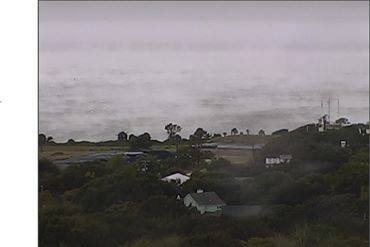
View from webcam at Fort Moultrie overlooking the Charleston Harbor – compliments of local Adam Jones with an admin manual whirl of the camera and the screenshot to accompany.
So the forecast that morning:
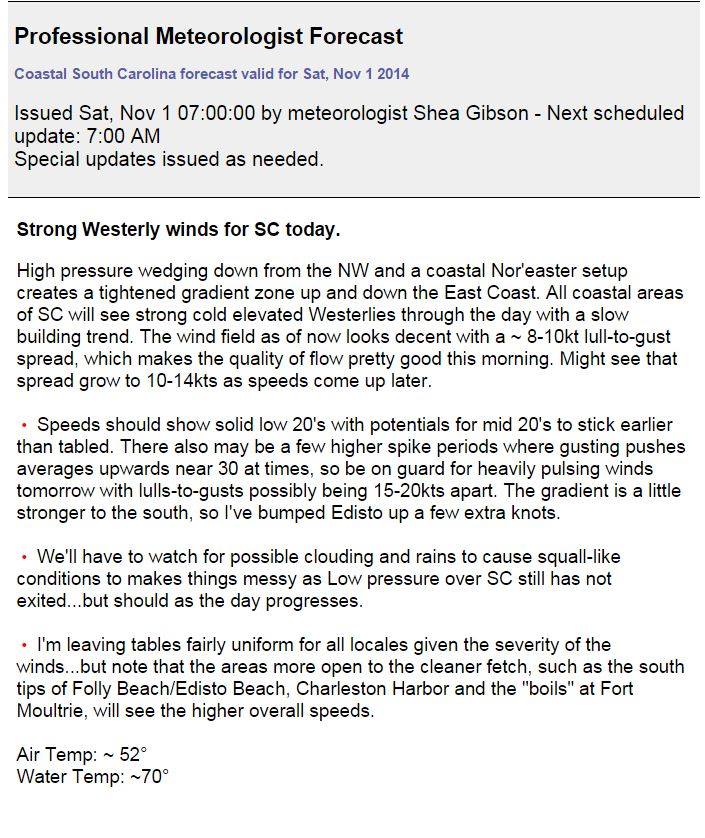
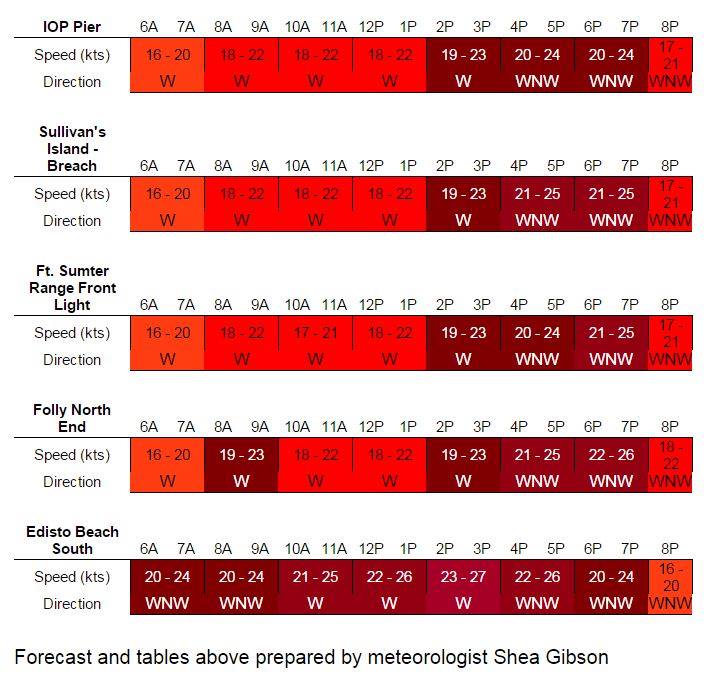
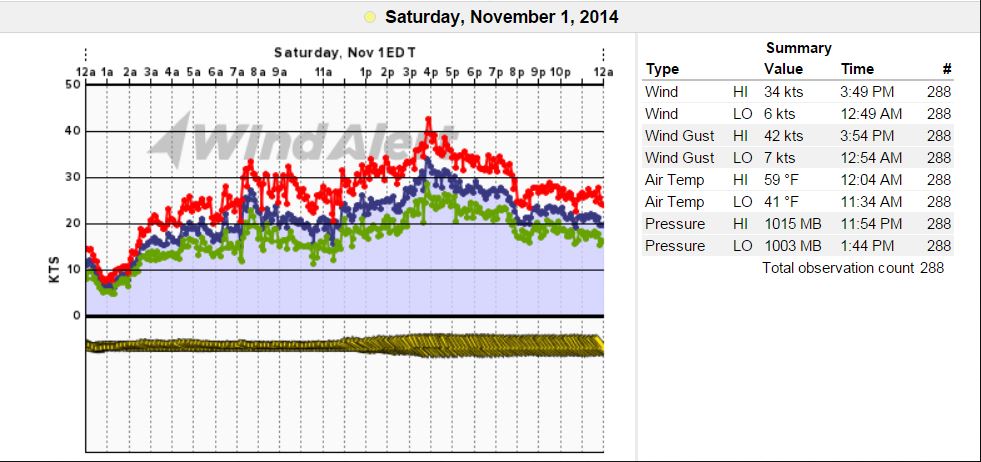
Well, winds built quite a bit stronger in the afternoon as the center of the Low pushed through just to the north of Charleston- especially as the exiting occurred and the gradient tightened along the western and southwestern side. After 2:30PM, values came up significantly as averages topped out at the 34kt range right before 4:00pm – pushing 42kts in a gust before easing back down to upper 20’s with low/mid 30’s through the rest of the day. NWS Charleston did issue a public information statement with our station reading.
Here’s the graph and information recorded from our sensor at the Fort Sumter Front Range Light:
OBSERVATIONS AND QUALITY OF THE WIND:
As I drove from the Wando area of Charleston to south Folly Beach that morning, the air temperatures dropped from 46° to 40/41°. Once at the southern tip of Folly (Folly Beach State Park), there were 2 kiteboarders already riding and winds were pretty solid with some moderate pulsing. As we were getting gear together, a low level area of clouding approached and temps dropped a few more degrees to the mid/upper 30’s (definitely felt the change by a several degrees) and a few small flurries became visible. We rigged up and during that 10 minutes, Sea Smoke started to appear on the surface. Water temp was ~71° as recorded the day before to give you an idea of how “warm” the water was. The gustiness of the wind field increased with the developing Sea Smoke, which created holes in the more consistent flow at the surface. Typically we see this type of marine effect to the wind field with warmer air and cooler waters..in this case the opposite. This made for much higher turbulence – and the cold air mass over the warmer water surface was unable to absorb the vapor – hence the evaporation effects we got here all around the Charleston area. You could literally see the spiraling columns of air being blown along by the wind – and you could definitely feel it in the kite as the yield spread between gusts and lulls were upwards of 15 kts at times.
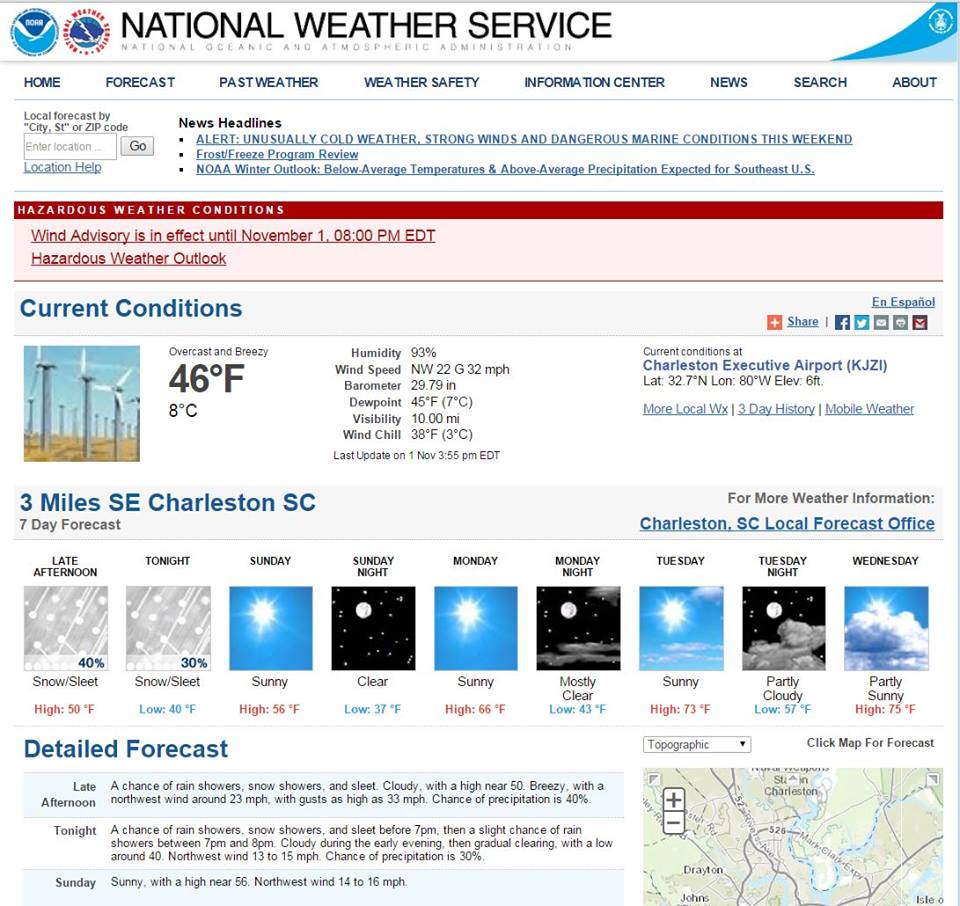
NWS Charleston issued this at 3:55pm after reports of sleet and flurries – air temps were UP and DOWN so the very sparse wintry mixes were in and out.
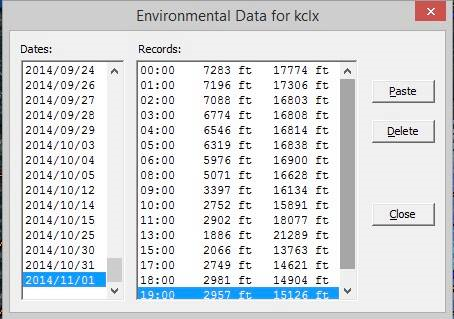
Here is a snippet from Jared Smith of Charleston Weather showing the freezing layer aloft drop from 7,283ft to 2,957ft throughout the day. Jared stated “Still remember watching the freezing level plummet in GR2 that morning as the core of the upper low moved by.”
One interesting note…Sea Surface Temps dropped from 71° to 64.9° over a 2 day course starting with this event. That’s a pretty significant drop for the SE Coast over a 48hr period.
All in all…this was definitely one for the records for future occurrences – and good learning material.
Cheers,
Shea Gibson
WeatherFlow Meteorologist/Wind Forecaster
SE Region /East Coast
New Stations Projects/Outreach
Facebook: https://www.facebook.com/WeatherFlowCHAS/
Twitter: @WeatherFlowCHAS
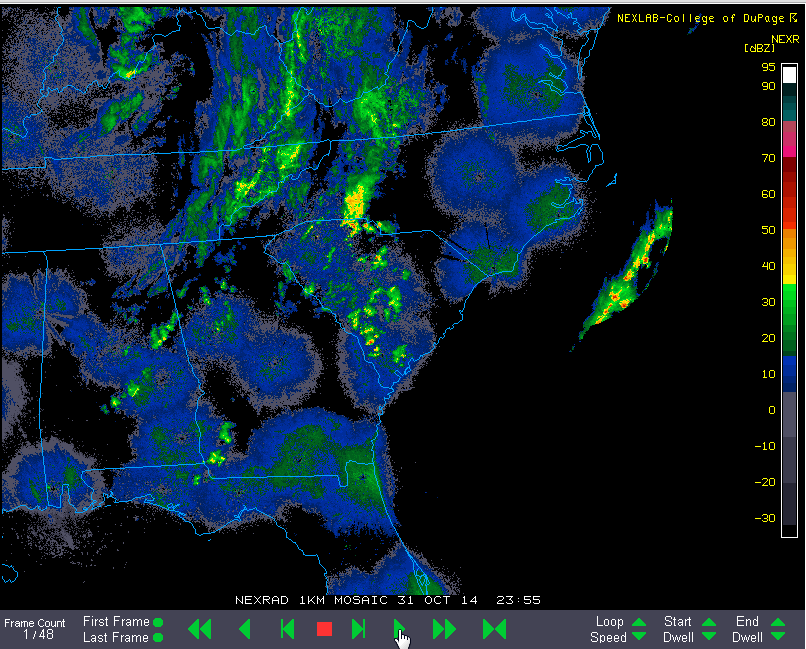
Sources: (Various observers), GR2 Analayst, College of DuPage NexLab, SFSU, WPC and WSI