Watch isobars dance as they create the Bay Area NW wind this afternoon.
by Mike Godsey, mike@iwindsurf.com
You hear about isobars all time in the forecasts along the west coast and you have long since figured out that the more isobars the stronger wind. But exactly what are isobars and what is their role in the Bay Area winds today. First let’s look at the major component of today’s NW wind, the North Pacific High.
In this first video you are seeing the North Pacific High spanning the waters between the California. Picture the North Pacific High as a huge flattened dome of high pressure air. In the center of the image where there is little wind is the center of the North Pacific High. Since this is a flat dome of air there is scant pressure differences in this area so scant wind.
Now move your eye towards the California coast. Notice how the wind really ramps up the closer you get to the coast. Why? Typically this flattened dome of high pressure steepens towards it edges. So we see a fast change from high pressure to lower pressure air. This means a strong pressure gradient which means strong wind.
To visualize this meteorologist use maps with lines called isobars. Each isobar is a line connecting areas of equal pressure. In the case of the North
 Pacific High this results in a map with roughly concentric circles. Since the pressure is pretty uniform near the center of the North Pacific High the lines are far apart. But in the 2nd image notice how the isobar lines really stack up near the California coast. This means that there is a marked pressure change near California so the isobars stack up. The resulting pressure gradient creates NW wind near California.
(Looking carefully at the 2nd image notice how the NPH has shoved a ridge into the Pacific Northwest and far Northern California. This movement pulls the isobars away from the Bay Area coast and allows the Central Valley thermal low to move almost into the Bay as you can see in the top right of the image. Today this ridge was almost back over the pacific by dawn but the next several days this will we a wind weakening issue.)
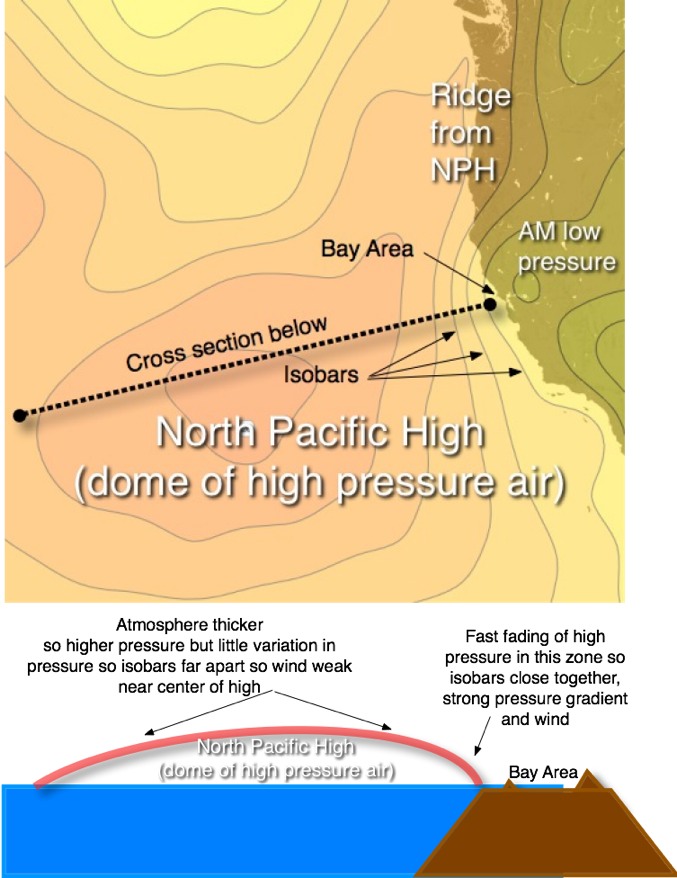
Now let’s try to visualize all of this by making a cross section through the NPH along the dashed line.
The 3rd image shows the rough shape of the NPH today. Notice how the flattened dome of high pressure air is depicted by the wind spread isobars. However check out how the dome steepens markedly near the Bay Area coast. This means there that over a short distance there is a strong change in the pressure. This is reflected by the tightly spaced isobars and the strong NW wind.
This afternoon as the SFO-SAC pressure gradient increases this NW wind will push up to the coast. But this is mostly a surface wind so it is forced to funnel through the gaps in the coast range. This means the wind will be strongest at sites downwind from such gaps.
But what really turbocharges those NW wind are local low pressure areas. Ever wondered why the Waddell and the Peninsula have such strong NW wind? To answer that let’s look at the last video of the modeled isobars for today, May 25. First notice the time bar at the top. Then check out this close up of the North Pacific High’s isobars you saw in the top images.
First looking at the Peninsula notice as the day progresses how the isobars compact along the Peninsula coast. This means a steep pressure gradient in this area and since the Peninsula has gaps facing the W to NW I expect strong winds at The Stick, Coyote, 3rd. and Palo Alto.
Now watch the isobars in the Waddell to Natural Bridges area. Tight isobars mean strong NW wind. But there is a mother variable at work here which makes this coastal zone a really wind machine. Notice the low pressure that develops in the Santa Cruz to Salinas valley area. This acts to really suck in that NW wind.