 by Mike Godsey, mikeATiwindsurf.com
ROUGH DRAFT
There was a recent forum thread on the Gorge Classic iwindsurf.com page asking “are there gustier winds this summer?”
The forum thread had answers ranging from “Obviously!” to “I hear this every year!” How you expereince gusts is impacted by many things like your gear, sail size, years in the Gorge and how good of sailor your are. Moreover, human memory is unreliable and easily biased.
So I have been looking at the Swell City sensor gust lull data. This sensor has its flaws but every one of you looks at that data so it is safe to assume it is somewhat useful.
So I have started analyzing the gust to lull ratio every 60 seconds for the Hatchery for this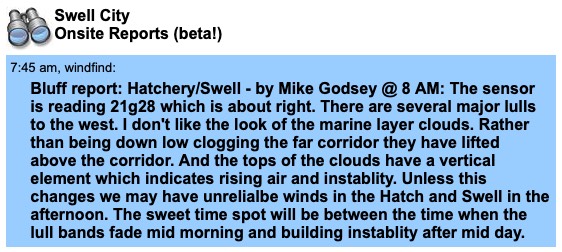 year vs. 2018 vs. 5 years ago vs. 15 years ago for the month of July. It is a massive amount of data but already the answer is emerging. The gust lull ratio has increased somewhat.
But this is not the real problem with Gorge winds in recent years.
Years ago strong gusty dawn patrol winds were the essence of Gorge windsurfing. All you needed were low compact marine layer clouds filling the western Corridor and a strong pressure gradient. For reasons I will get to that pattern started becoming increasingly less reliable. That is not to say we don’t still get epic days. And this May and August had some great days. But somethings have changed.
Since my windows look down Columbia from the White Salmon Bridge to way past Viento the changes were obvious to me. So about 12 years ago I started doing the Hatch and Swell Bluff report several times each morning. This Bluff Report describes what I am seeing from my house versus what the sensor is reporting.
It was clear to me that in the early morning the winds on the water were frequently either far weaker or stronger than what the sensor was reporting from atop the small cliff at the east end of the Swell City parking lot. This was because of gust and lull bands slowly marching down the corridor in the early morning.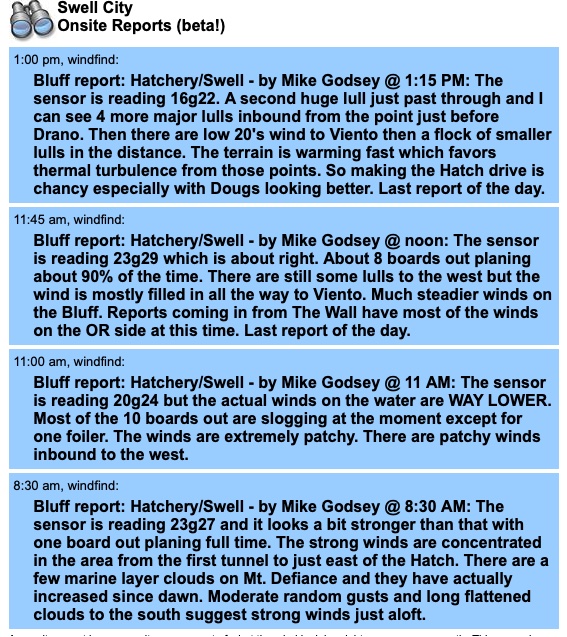
In the early years I would do 2-3 of Bluff Reports until the gust and lull bands subsided and the sensor and the wind on the water were about the same which was typically between 9 and 10 AM. And I would sign off the final report with a “Last report of the day.” which meant I was on my way to the Hatch and there were likely to be solid gusty winds much of the day with perhaps a “mid-day” lull.
But in recent years it became much hardier to do a meaningful Bluff Report. The gust and lull bands west of the Hatch and Swell zone became larger and more numerous and lasted more of the day. This made doing the Bluff Reports way more difficult.
So, for example, I would do a 10 AM Bluff Report saying the sensor and the white caps both agreed that the winds were mid 20’s. But then 15 minutes later I would look out the window and see a lull band moving into the Hatch and Swell area and the winds were only mid-teens.
You can see this issue in my Bluff Reports for yesterday, August 24.
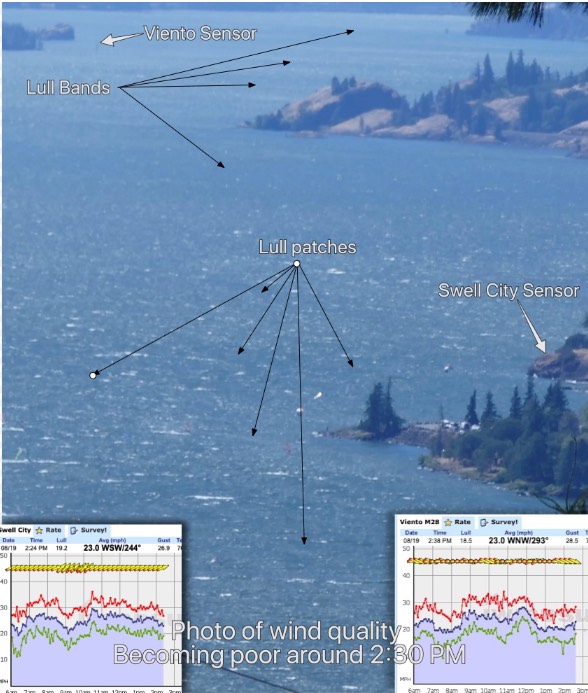
Let me show you what these gust and lull bands look like from my house. This is what I saw at the 11AM report above. Notice the lull band right off Kodak Point at the Hatchery and the second in the “Basement” area between the Hatch and the White Salmon Bridge.  Then the 4 lull bands west of Swell City and the large Point east of Drano. And in the far distance, you can see more lull bands. Interspersed between all these lull are strong gust bands.
n the water or at the Hatch or Swell launch sites you can’t see these bands. What you do notice is the wind looking really good and then a while later looking really bad. And if you are on the water when the transition from a gust to lull band passes the wind seems really up and down.
So what causes these gust and lull bands?
The Gorge has always been a gusty place for several reasons.
- We are far from the ocean and the marine layer is often breaking up by the time it reaches the Gorge so we lose that wind stabilizing influence. (Unless you get out really early when the land is still cool AND on a day without bands or you go to San Francisco where you are next to the marine layer)
- Our wind is often jacked up by strong winds just aloft. These winds hit our topography and become turbulent with lots of up and down motion which randomly transfers momentum to the surface winds. You experience this as abrupt gusts and lulls and even shifts. Can you figure out why the winds are steadier way out east?
- There are large points sticking out into the river west of the Hatchery and as the surface wind hits these points turbulence is created causing the bands you see in the photo above.
- As the sun beats on these points the land heats the air and parcels of hot air rise this causes gusts as the inbound air accelerates in those spaces. You experience this as patches of stronger and weaker wind on the water. The same thing is happening as the sun bakes the Washington walls of the corridor.
- Lastly, the winds are often at an angle to the Gorge creating more turbulence. And more WNW flow favors some sites while WSW flow favors other.
Over the last decade factors, 1 and 4 and 5 above have changed.
Poiint 1. All along the west coast the average depth of the marine layer has thinned. This has radically changed the windsurfing and kiting for many places. For example, Sherman Island, in the San Francisco Bay Area, used to be renown for steady winds peaking in the early morning and afteroon and often lasting all day. Now with a thinner marine layer it sees those winds less frequently. In the Gorge it means the marine layer clouds do often do move as far inland in the afternoon. And that means a greater gust lull ratio. The reasons for this are complex but basically, for a deep marine layer you need a cooler ocean.