San Francisco customer says:

“Hey Mike, Check out the graphs for Larkspur yesterday and today. Those extreme up and down sequences are rather unusual for our sea breeze conditions. Is there some way you could have predicted the up and down conditions? Rick“
Hi Rick, One of the main ways I learned to improve the forecasts in the Bay Area was hiking or driving and studying all the gaps in the coast range that funnel the ocean winds towards different launch sites. One of my favorite hikes for learning about the wind was Marin’s Ring Mountain. The view from this mountain is a natural wind laboratory since you can see the fog and wind coming through the Golden Gate towards Pt. Isabel and the fog and wind in the Muir Gap coming towards the Larkspur Landing launch site. You can even see the entire wind pathway from Muir Gap to the winds stirring the white caps at Larkspur Landing.
This background helped me in answering your question.
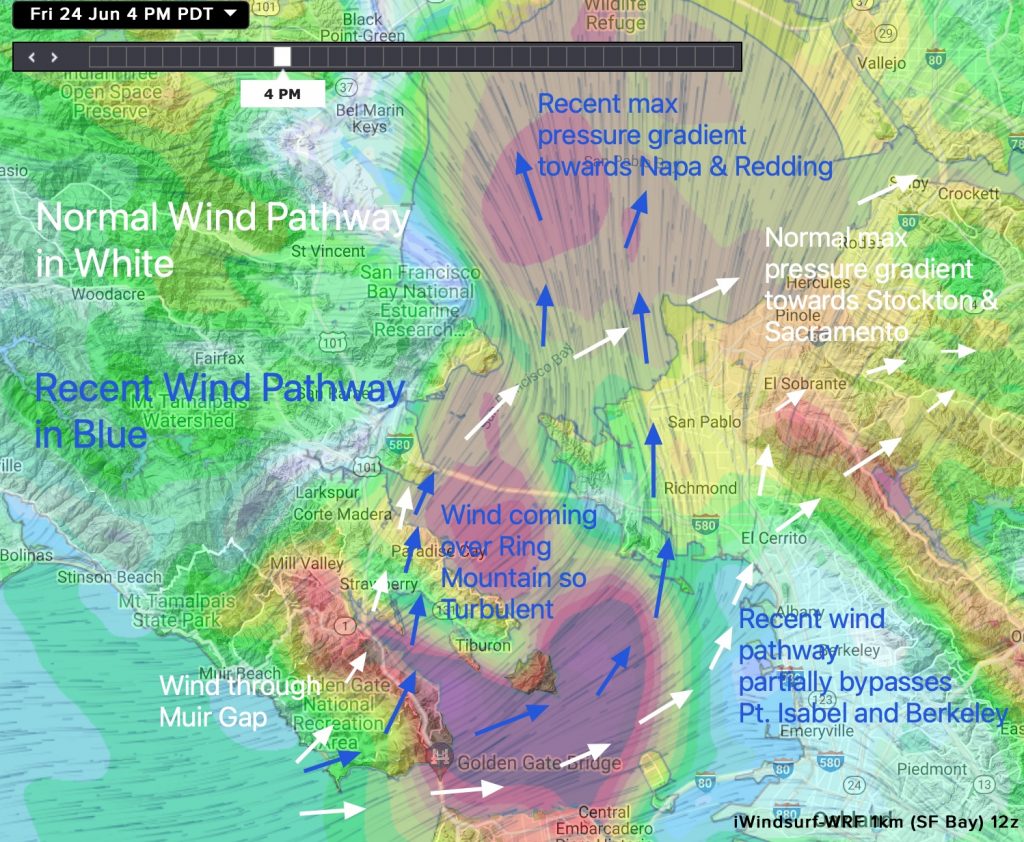
On the days you mentioned there were WSW ocean winds from an eddy. Normally southerly winds help Larkspur since if the pressure gradient is towards Sacramento wind funnels through the Muir Gap area then through the Corte Madera Hwy. 101 gap to the launch site following the route you see in the WHITE ARROWS in this model output. Since there is only modest terrain in the latter part of this pathway the Larkspur Landing wind is typically steady.
But on the days you mention the gradient was strongest towards Napa and Redding. You can see the strong flow heading from the Golden Gate towards Napa in the image above.
How does this atypical flow impact Larkspur? Looking at the BLUE ARROWS you can see that this gradient makes the wind come over the Marin Headlands and the slopes of Ring Mountain. If you have ever hiked Ring Mountain you know its rocky slopes and parched grasslands get hot. Hot air rises so as the ocean air moves over the slopes it encounters the rough terrain of the mountain AND masses of rising air. This induces turbulent flow so that by the time the blue arrow winds reach the launch site they are very up and down as you describe.
So now you have a simple answer to your question. Keep reading for more details in this next graphic using these numbers:
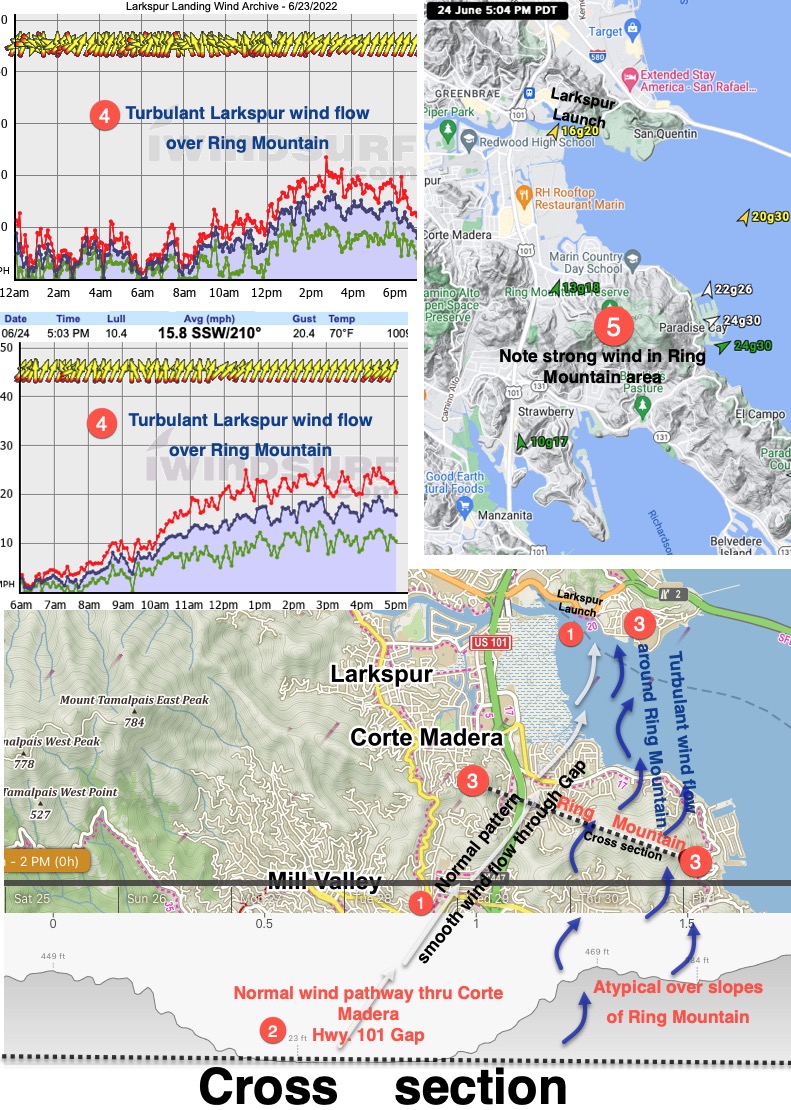
1. White arrows show the typical route wind takes to Larkspur Landing from Muir Gap along Hwy. 101.
2. Shows a cross section of the topography from Corte Madera past 101 to the far side of Ring Mountain. Notice how the white wind arrows stream through this gap which is only slightly above sea level
3. The blue arrows show shows the pathway the wind takes around Ring Mountain when there is a strong gradient to Napa. Wind on this pathway hits topography and rising bubbles of hot air that produces turbulence.
4. Shows the wind graph on June 23 & 24 for Larkspur with very up and down winds.
5. Take a look at the sensor readings around Ring Mountain. These strong readings support the Napa pressure gradient hypothesis of turbulent wind.
Lastly, yep, I think I could forecast this in the future.