
Southerly storm track and surface ridges are the culprits.
by Mike Godsey, mikeATiwindsurf.com
So far this spring there has been lots of passing storms but rather sparse NW clearing winds in the wake of storms.
Part of the problem is that the storm track is a bit further south than typical this spring. And that tends to force the North Pacific High’s average location west of Southern California depriving the S. F. Bay Area of NW wind.
But the other problem is that even when we do get NW clearing winds we are seeing mostly a 1 day blow while most years we see a very strong first day of wind followed by 1-2 days of steadier but weaker winds.
This season we may get the first day but the following days the forecast mentions NNW to NNE winds at the ocean buoys, aloft and in the Central Valley and then weak NW in the afternoon.
The following images will help you understand what is going on with this pattern.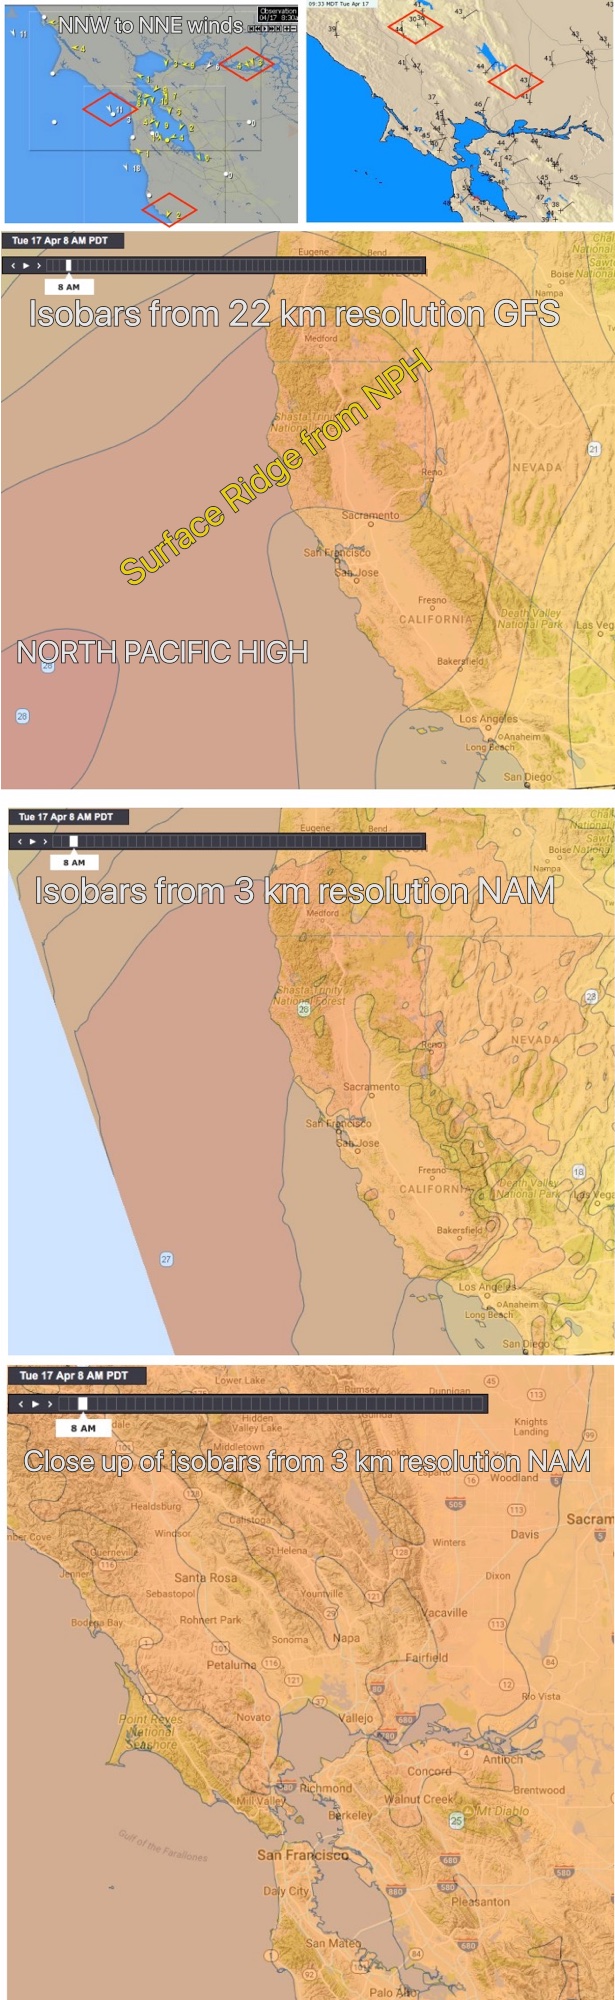
This first image from 10AM today (April 17) shows the a surface ridge extending from the North Pacific High to the west.
Notice the isobars entending from the NPH into Northern California north of the Bay Area.
Also notice how this ridge promotes NNW ocean winds and NNW to NNE winds in the Central Valley and about the Bay.
The next image shows theBay Area windgraph from 8AM today. Notice that many of the sensors show weak NNW to NNE winds. In particular notice the NNW winds at the ocean buoys.
And the image to the right shows a similar pattern for sensors beyond the Bay Area and in the Central Valley.
All this northerly flow tends to weaken in the afternoon but it still delays and weakens the winds inside the Bay.
In the next image we are seeing the isobars in the ridge extending from the North Pacific High. The ridge is very easy to discern in this image from the low resolution GFS model.
Such low resolution models are useful for seeing the overall weather picture like this ridge.
But when it comes to forecasting wind at a particular site higher resolution models are superior.
The next image shows the isobars from the NAM3.
Notice how it is harder to discernt the ridge but you can see the pattern of higher and lower pressures that play a piviotal rold in determining the actual wind direction and strength.
The last image zooms even closer into the Bay Area and you begin to see the complexity of the pressure gradients that determine our wind.