
by Mike Godsey, mike AT iwindsurf.com
Note: This blog uses Southern California as an example of picking the best model using ship reports but the basic idea of the blog is relevant to all regions in the USA.
On winter days as I walk through the La Ventana campground I am always impressed by the thoughtful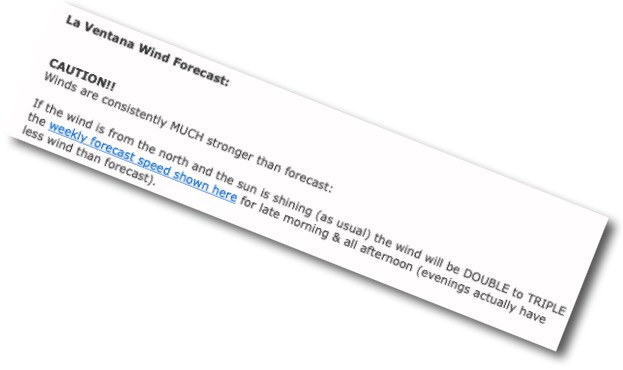 kiters and windsurfers who print out and post the day’s forecast on clipboards right where folks stand to judge the winds. But I also feel a bit downcast when I see the models they pick to print. Most of the time they pick websites that use the old GFS model. The same is sometimes even true for the web sites for local resorts as you can see in this, all too true, warning about the model output from the Captian Kirks resort.
Don’t get me wrong. The GFS model is great for following large scale wind patterns and is one of your best choices if you are forecasting storms or if you are a mariner. The problem is that the GFS resolution is too low to properly factor in the topography that so strongly impacts the wind at most launch sites.
The trick in forecasting anywhere is to know which model, on any given day, is doing best at capturing the reality of the wind later that day. And that takes years of experience as well as knowing how to interpret satellite imagery, weather balloon reports and, and yes, even ship reports.
Let’s take a look at this Southern California day as depicted by the windy.com web site and how well the ECMWF 9 km model did forecasting an eddy compared to the NAM 3 km model.
The first part of the animation shows the ECMWF 9 km forecast for an eddy over the Southern California Bight. Notice how the forecast eddy spans almost the entire middle portion of the Bight. This large eddy is supported by the NNW winds you see in the upper left corner of the image. It is also supported by a thermal trough extending from a low pressure just north of the Sea of Cortez. Note how the modeled isobars of the thermal trough cover the entire Southern California Bight.
Such a large eddy could easily keep the afternoon beach winds very weak. So in forecasting, we have to determine the accuracy of this model output. Sometimes we can do this by looking at the swirl pattern of the marine layer clouds in the satellite imagery. But often that imagery is too fuzzy at 7AM. Another way is to look at wind reports from ships traversing the area.
As you examine the ship wind reports below notice that the furthermost south ship report does not jibe with the ECMWF modeled eddy.
Now, look at the NAM 3 km animation. Notice how the NAM has the isobars of the thermal trough more focused in the northern Southern California Bight. Now looking at the ship reports notice how their wind reports more closely follow the modeled eddy winds.
So, in this case, I would tend to forecast the eddy dying midday and wind peaking in the Long Beach area. Why, because I picked the right tools for the job which in this case was using the NAM output and ship reports.