Hi Gang,
The graphic below is for a blog I will do later next week. But it is more timely today as our pressure gradient pattern changes a bit.
The key concept is that when the NW ocean wind reaches the coast it flows through gaps that are the easiest pathway towards the maximum pressure gradient in the Central Valley.
Since the Central Valley has a huge N-S range so the pressure gradient is sometimes unevenly distributed. So if the max pressure gradient is towards Bakersfield the wind curves through the Bay hitting certain sites.
If the max pressure gradient is towards Sacramento to Redding then the NW curves to hit other sites.
Of course, if the ocean winds are more SW, like when we have an eddy to a marine surge after a heatwave, the wind flow is very different than in these graphics.
Hopefully, the graphic is somewhat self-explanatory but if not wait for the blog. 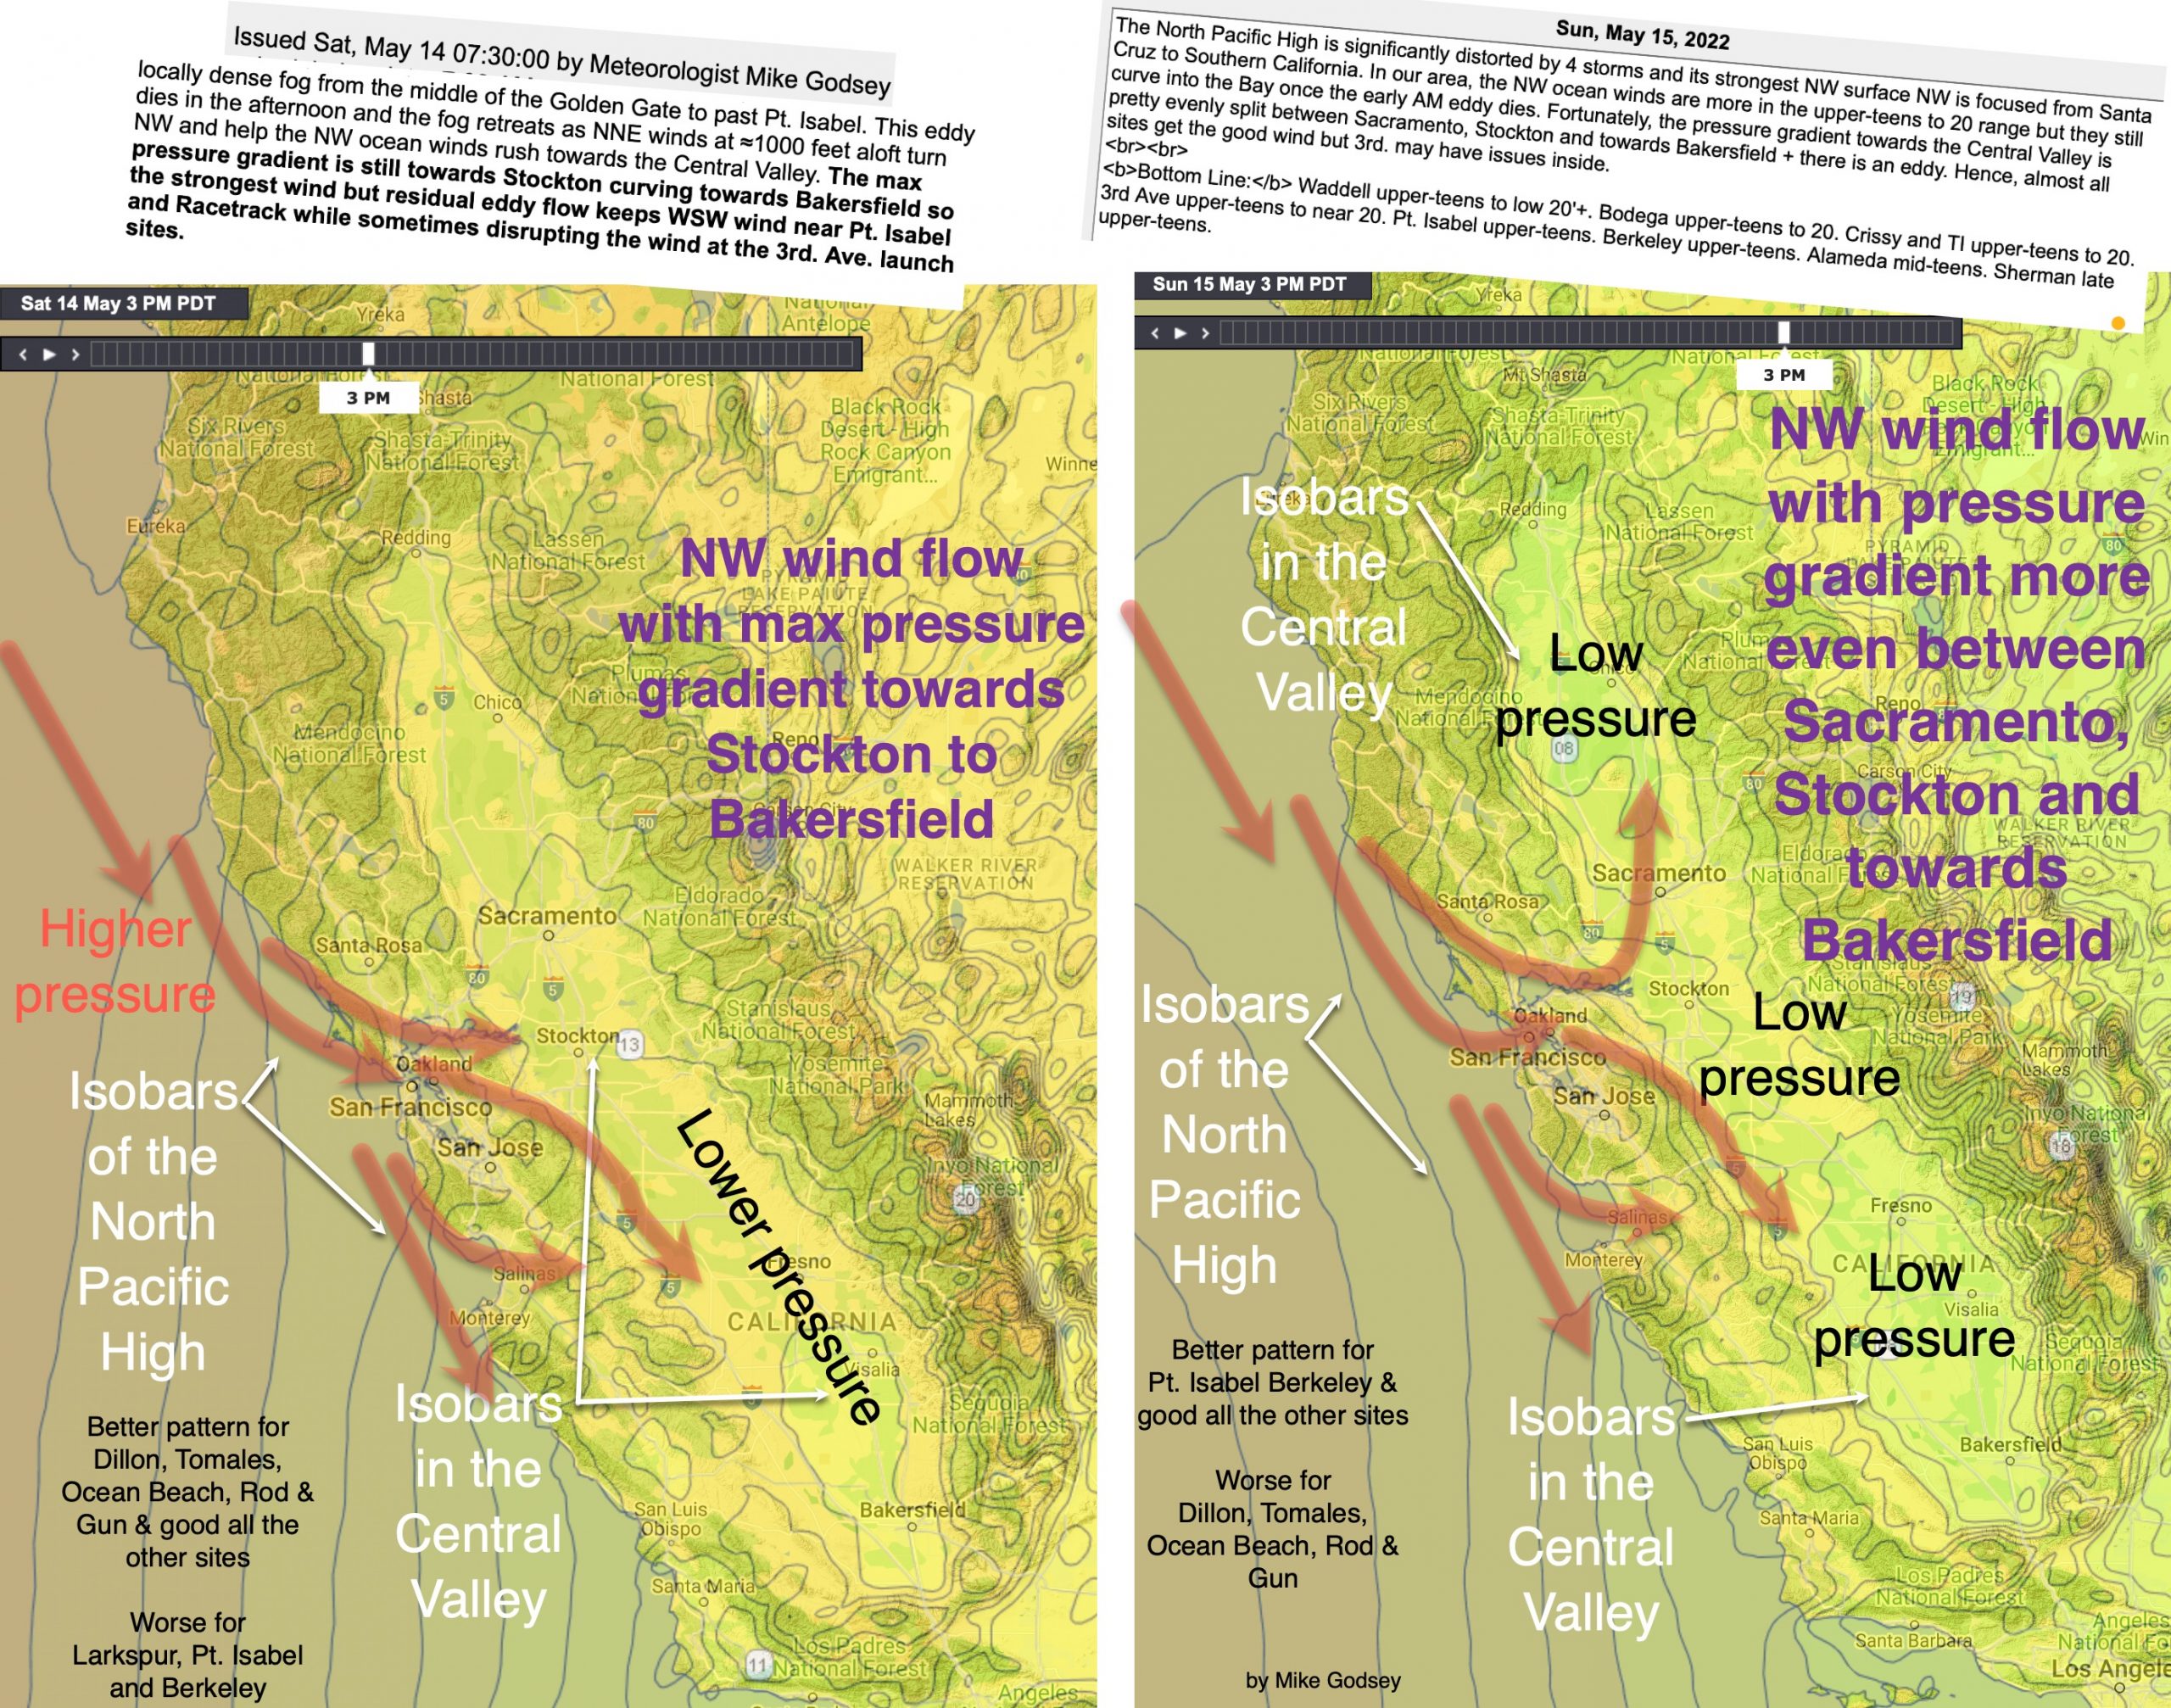
Mike Godsey