by Mike Godsey
I am going to let the modeled weather imagery tell most of this story.
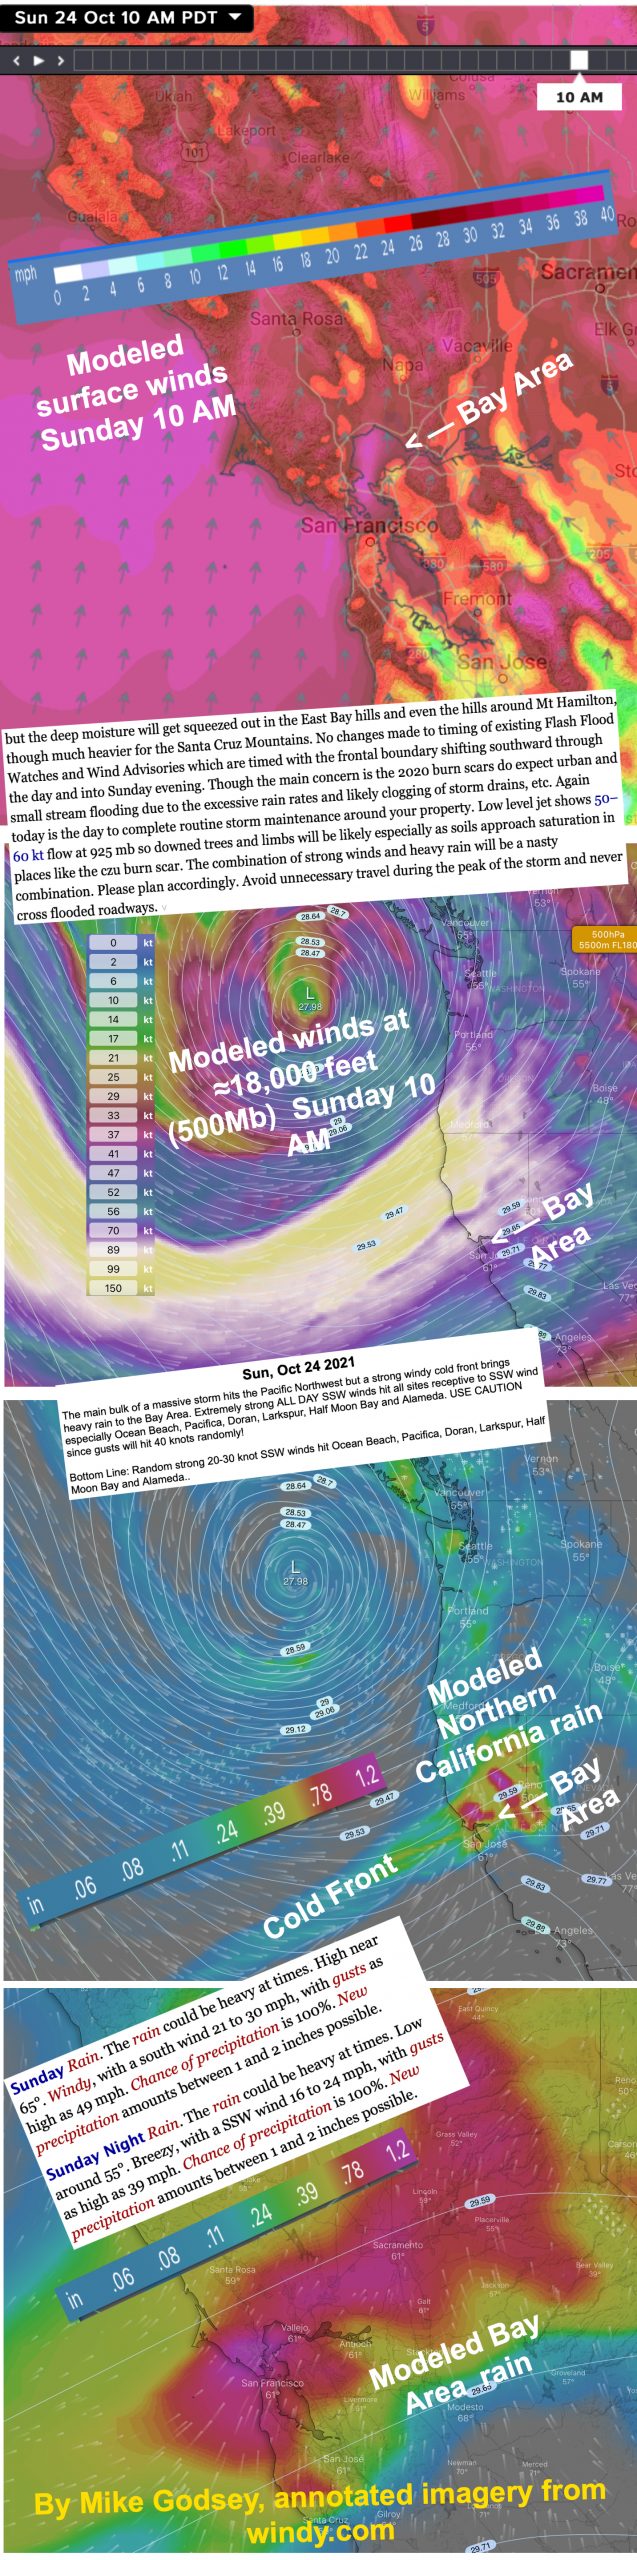
The first image shows the very powerful SSW winds created in the San Francisco Bay Area by a storm centered about 700 miles west of the Columbia River Mouth.
What this image does not show is that these winds will be very Up and Down as they hit the Coast Range and ripple down randomly to the surface waters.
Also, note the warnings from the NWS regarding flash floods and dangerous road conditions especially near recent burn areas.
The next image shows the very strong winds aloft in an upper trough at ≈18,000 feet (500Mb). The peak winds aloft may approach 100 knots.
Note the marked “divergence” in the winds passing over Northern California as the winds of the upper trough spread out from their concentrated flow over the ocean.
This “divergence” creates low pressure aloft that greatly strengthens the storm’s surface winds.
The next image shows the modeled rain distribution and amount of rain.
Notice that the heaviest rain is in the cold front area that passes directly over the San Francisco Bay Area.
The last image shows a close-up of the modeled rain in the greater Bay Area. Notice that there will be relatively dry spots in the lee of mountains where there is a rain shadow.
Remember that as these SSW winds hit the Coast Range they will become turbulent and the surface winds could blast and die very fast. This is especially true when there is locally heavy rain.