They determine if the 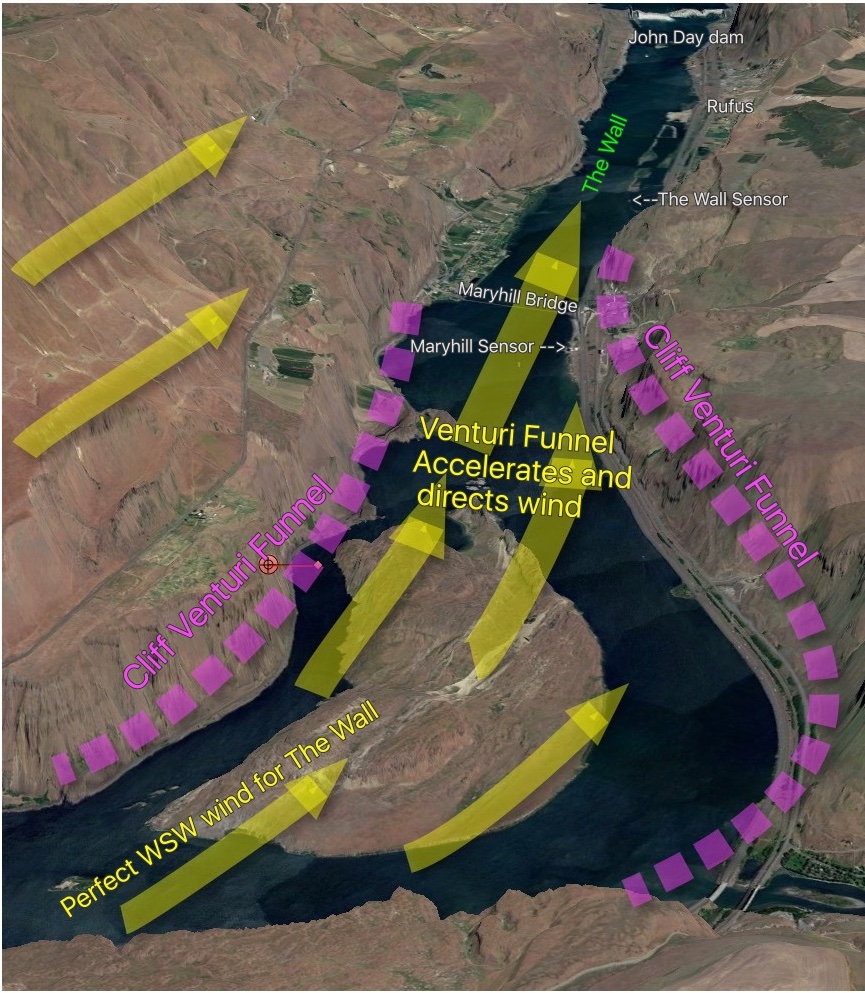 The Wall is Great or Hate!
by Mike Godsey, mike@iwindsurf.com
Take a look at the swell near The Wall in my banner above. Notice how the big swell is uniform reflecting solid WSW wind from Oregon to Washington on an epic Wall day. This VIDEO link shows the sort of action you see at The Wall on this type of day.
The image on the right shows the perfect set up for The Wall. Since the Columbia River runs overall from East to West there is a tendency to think this is true all along the river like it is at The Hatchery.
However at The Wall the river is actually running from NNE to WSW. This means that the best set up for The Wall is WSW winds.
Looking at this image notice how the vertical cliffs on either side of the river SW of Maryhill act to funnel (pink dashed lines) WSW wind into the waters of The Wall. Also notice how the constriction of the cliffs in this zone make a venturi effect accelerating the winds as they pass by the Maryhill Bridge on the way to the Washington side of the river.
 Next, notice the location of the sensors on the Oregon side of the river. Note how the Maryhill sensor (just west of the Bridge on the Oregon side) and and “The Wall marker 40” sensor (just west of the actual Wall zone on the Oregon side) These sensors are well sited for the winds on the Oregon side of the river but can not pick up the winds on the Washington side of the river.
Having 2 sensors so close to a launch site is a treat for our customers and reflects the importance weatherflow places on The Wall as a customer destination.
But paradoxically the complex curving course of the river and the tortuous cliff topography makes the winds do some really strange things in The Wall zone. This means that sometimes these 2 sensors show upper 20’s or even low 30’s wind from the SW but when you arrive at the Washington launch sites you either find almost NO wind at the launch sites or WNW wind that blast on the Oregon side but are on and off at the launch sites. This is especially frustrating since most of us sometimes drive around a hour or more with the expectation of strong wind only to find barely useful wind.
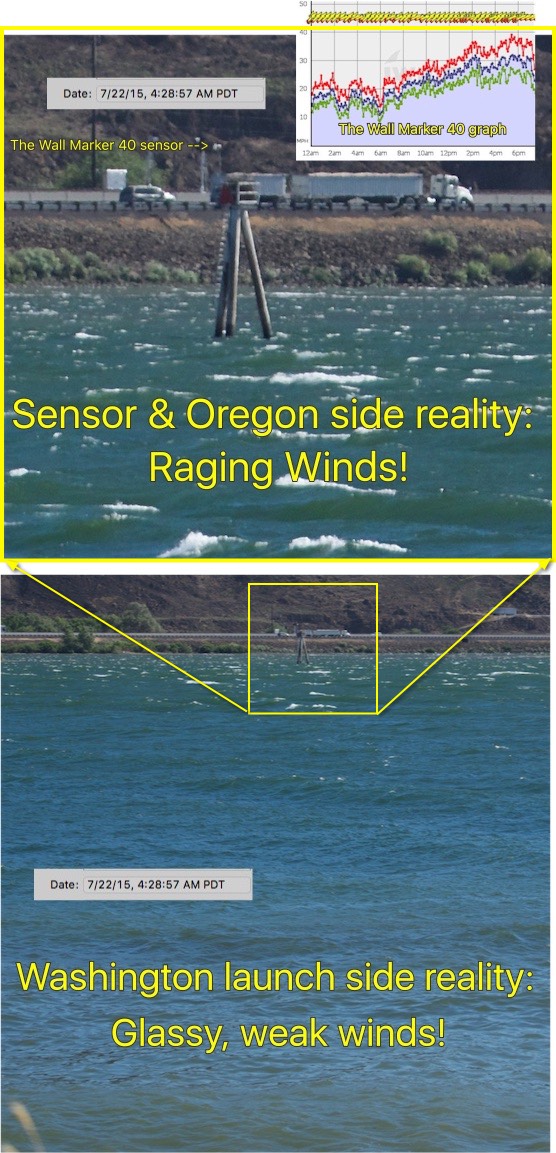
The next 2 photographs show such a day. In the top image, I have zoomed in on the waters around the Wall M40 sensor near the Oregon side. Clearly, the winds are ripping at the sensor and the wind graph at the sensor reflects this with upper 20’s or stronger wind from the SW. So sitting at the Hatch and seeing that wind graph you would probably hit the road expecting and Wall day.
But now look at the zoomed out version of the same photograph. You can still see the raging winds over on the Oregon side but note the near glassy slick and weak winds on the Washington launch side. You all know the sinking feeling as you drive onto the gravel road and see that slick.
Personally, I take the Stonehedge road overlooking the entrance of The Wall so I can reroute to a different launch site if the slick is large.
So what often causes weird powerful sensor readings at Maryhill and M40 when the river is actually weak at the launch sites?
The answer to this question is complex but has to do with variations in the overall wind direction. In the very top image we saw that the best overall wind direction for The Wall is usually WSW. But often the overall wind is NOT WSW with W. being the most common. So let’s look at a graphic showing what west winds do to The Wall.
Incidentally, the next graphic summarizes the about 3 years of research. Each time I found crappy wind at The Wall despite great sensor readings I drove around all the roads on both sides of the river with image stabilize binoculars watching ripples, swell, wind turbine direction and even the wind patterns on grassy fields. But the biggest break through happened several years ago when there was a fire to the west which sent smoke down the river. Voila! A natural wind tunnel with smoke as streamlines. Watching the smoke really gave me insight into the weird way wind funnels around The Wall. And since it was a Wall bad day with weak wind at the launch sites I could see the smoke hugging the Oregon side of the river despite great sensor readings from our sensors. I also have a wind tunnel app that I have run over a simplified version of The Wall and it provided additional support for my reasoning below.
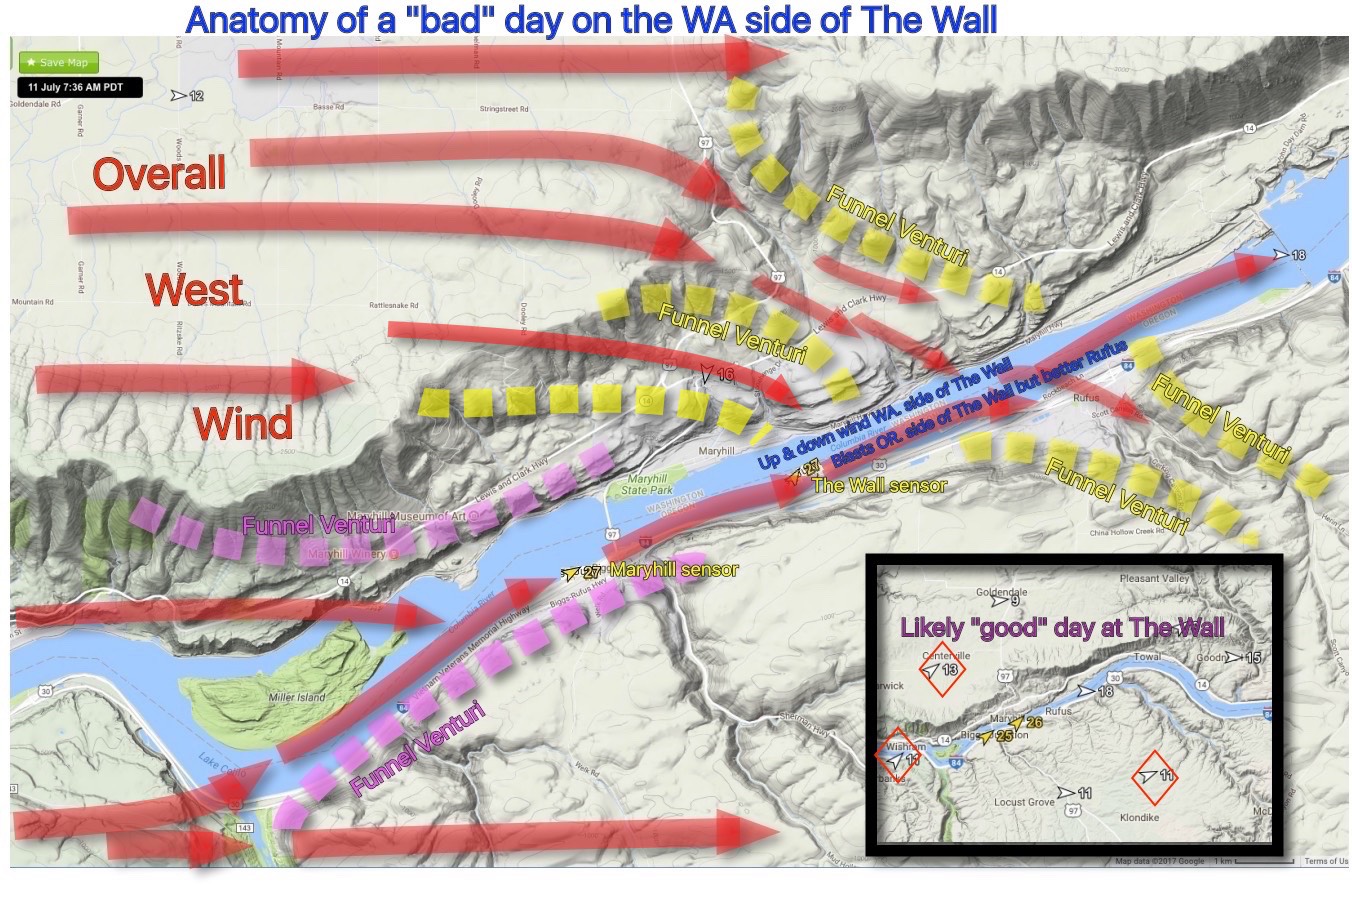
So looking at the image below of a “Bad” day at The Wall notice that the overall wind flow is West over the eastern Gorge. At the Hatch this works well since the river runs rough E. to W. but remember that the river runs NNE to WSW in the Wall area.
First, note how the cliffs at the top of the image act to funnel (yellow dashed line) the West winds so they turn WNW in The Wall zone. This is especially true in the boat ramp area but impacts all the launch sites. At the launch sites you notice this as gusty WNW winds blowing slightly offshore or from your back as you face the river. This WNW flow is usually very gusty and is going at an angle across the river.
Now notice how the cliffs west of Maryhill make a funnel (pink dashed line) that tends to turn the West wind more WSW to SW near the Maryhill Bridge.
As these two winds interact the WNW flow coming down the yellow funnel tends to intermittently push the SW to WSW wind towards the Oregon side where the sensors are located leaving the Washington launch sites with weak or even intermittently calm wind. Can you guess where the best launch site is in the area in this pattern?
This next image shows you what happens when the overall winds in The Wall area are WNW. If you are at Rufus the winds seem like they are coming across the river from the turbines. Yet the  Maryhill and M40 sensors are showing strong SW winds. Making the long drive in this situation is a real fail.
So how do you tell when The Wall is going to have a good or a bad day? First read the forecast carefully looking for any mention of WSW flow. Next take a look at the black insert in the image above.
The more nearby sensors you see that are showing WSW wind like those in the red diamonds the more likely there will be WSW winds entering the Pink funnel and the less likely there will west wind entering the Yellow funnel.
So put the new iwindsurf or ikitesurf web site in the terrain mode like you see below and look at all the sensors within 20 miles of The Wall before you make the drive.
Here is a link for that overall view of The Wall zone using your regular iwindsurf or ikitesurf account: The Wall overall winds
Unfortunately, the wind often shifts from WSW to more West during the day so even this technique is not full proof. Lastly, the stronger the winds the less the impact of the yellow funnel so when the sensors are into the low 30’s there is so much wind on the river that you are likely to have an epic day especially at The Cove and The Marker.
So the further increases your chances of success use a web site that allows you to easily step through hours of the day while watching the overall wind direction.
Still, I have to confess that I find sailing The Wall so addicting that I find the melody of the Pink Floyd music in my head irresistible and make the long drive despite an abundance of contrary evidence.