by WeatherFlow meteorologist Shea Gibson
Well. Enough words cannot be said about what just happened here in the SE Region. Specifically to South Carolina. What could have been a “possible” hurricane landfall from Hurricane Joaquin became a rain event of historical levels.
Why did this happen? Let’s go back and view the weather pattern setup. Then we’ll take a look in time to see how this all came together, starting with September 27th forecast, for which the computer models indicated several things coming together at once. Then we’ll start with actual real time maps/predictions on September 29th and work forward.
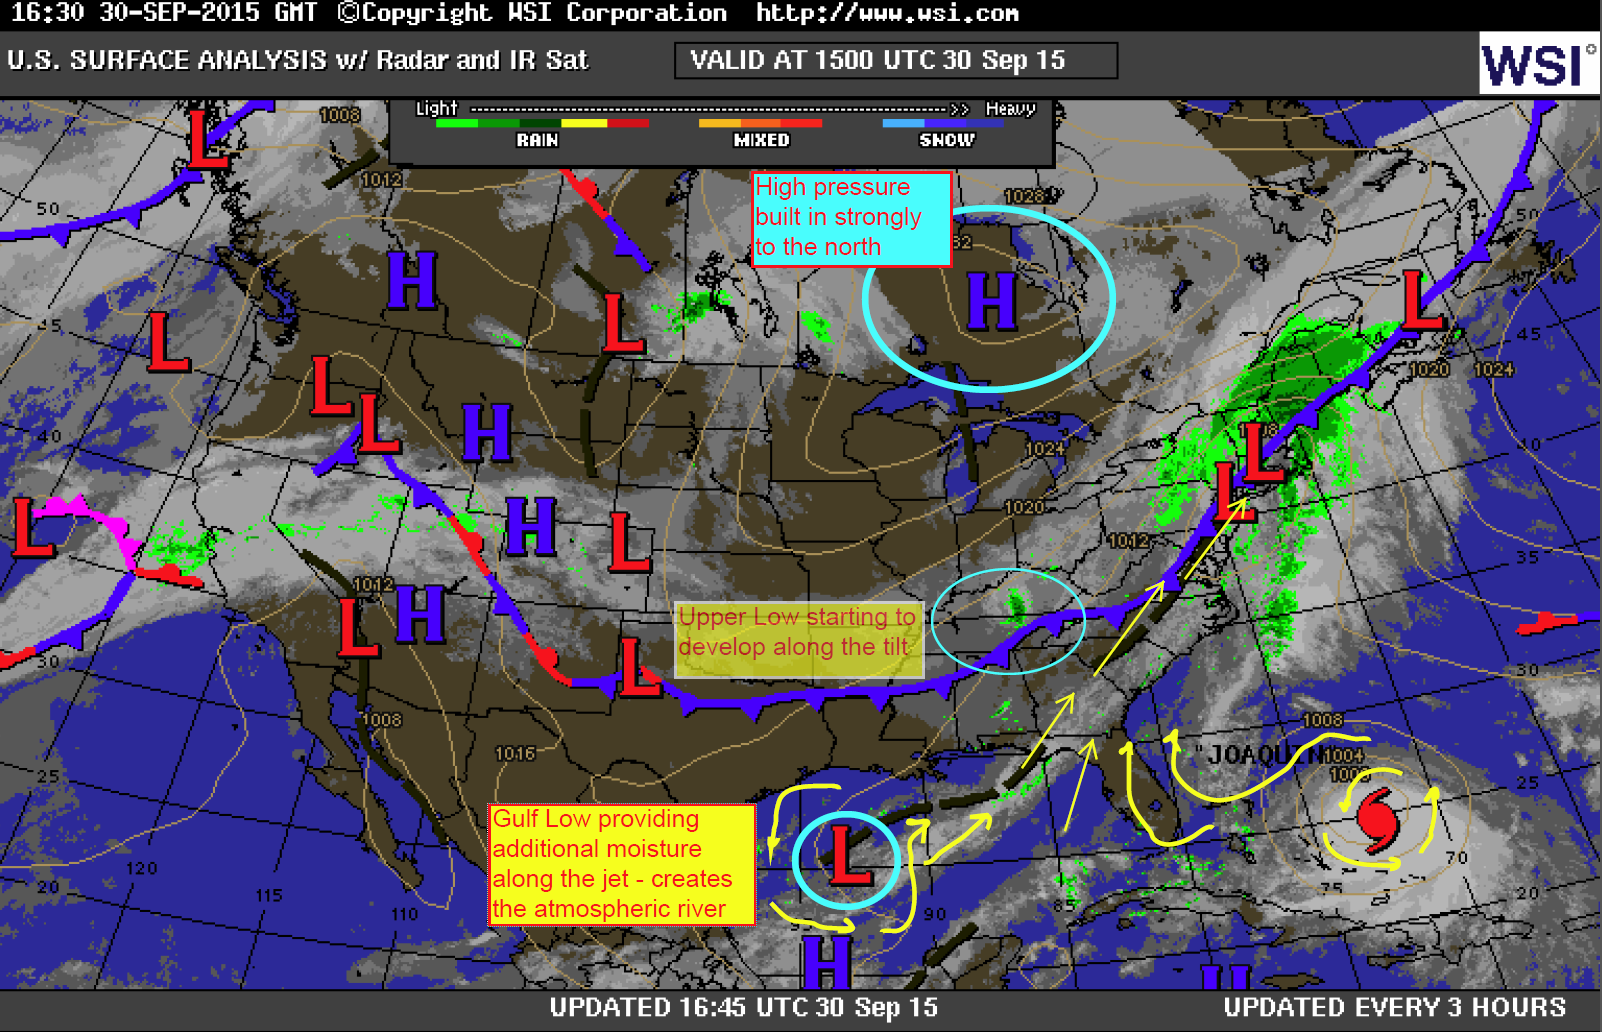
To start it all out, a very large dome of High pressure developing across Eastern Canada acted as a blocking cap to the north. This kept all low pressure activity to the south.
An area of weak upper Low pressure pulling away from Texas heads ENE along the Gulf states to join what would become a downward dip in the atmosphere from a cold front dropping down towards the SE Region. This would be known as a “negatively tilting trough” in time.
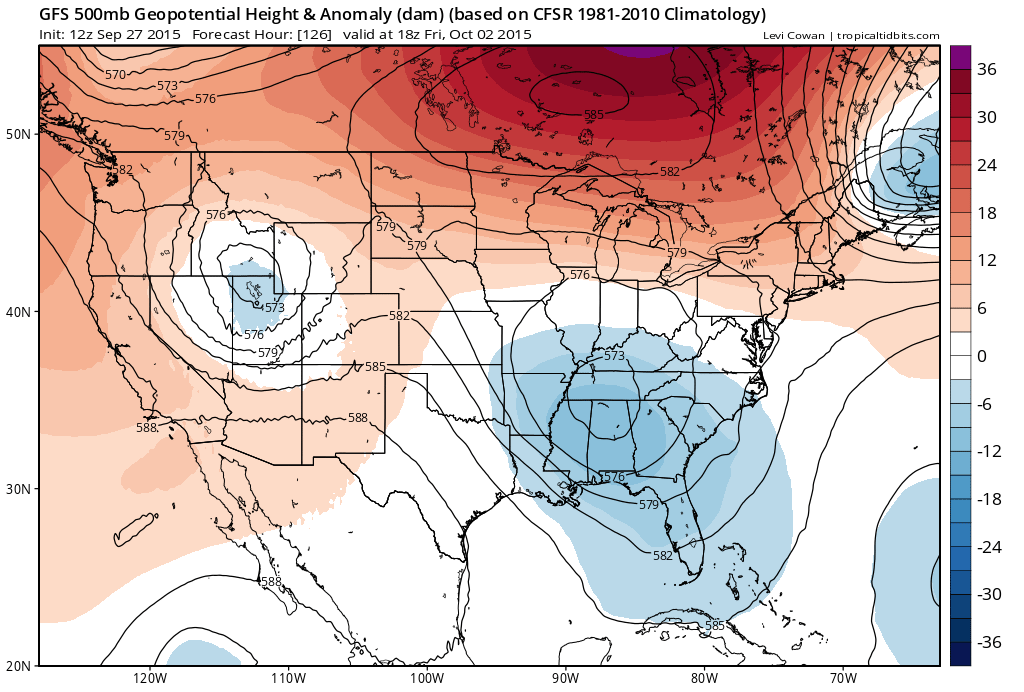
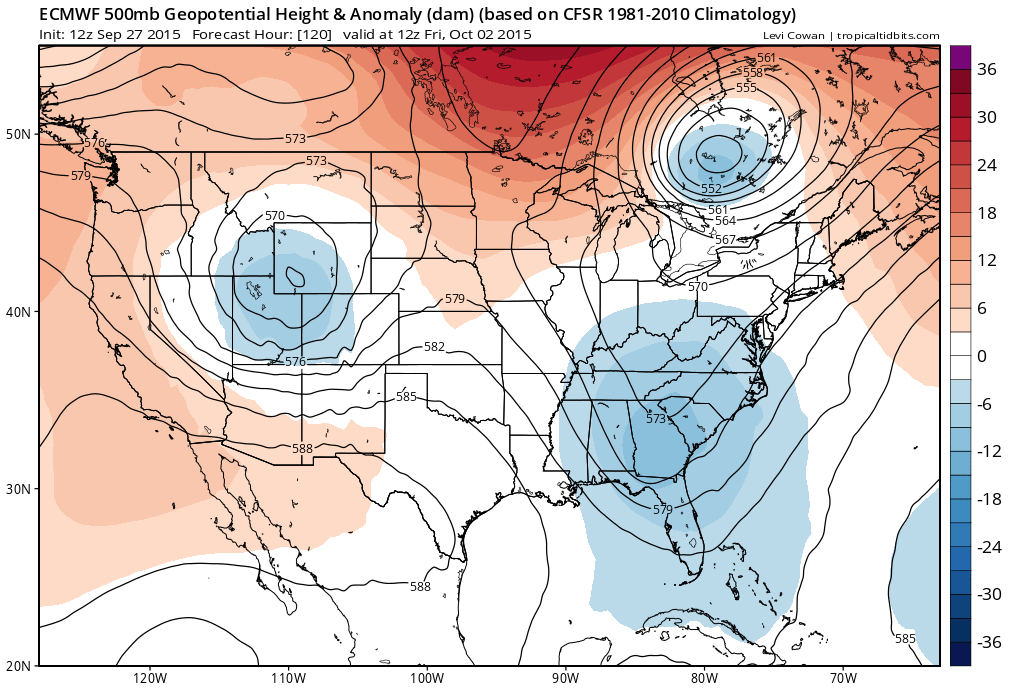
This was forecast by the American GFS and the European ECMWF to occur on the same day on October 2, 2015. At 500mb (18,000 feet) …The blue represents Low pressure aloft, and the red colors represent High pressure aloft. The Euro seems to have gotten a better approximation of the dip and a better overall setup, with the GFS developing closed upper Low pressure earlier.
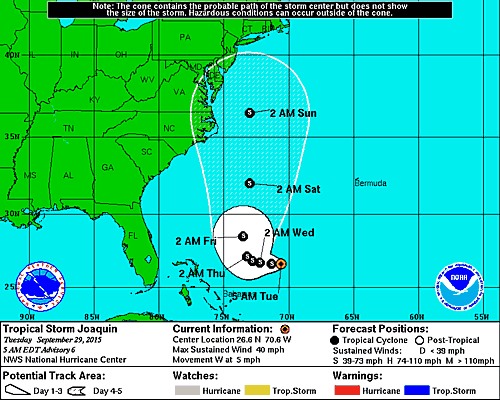
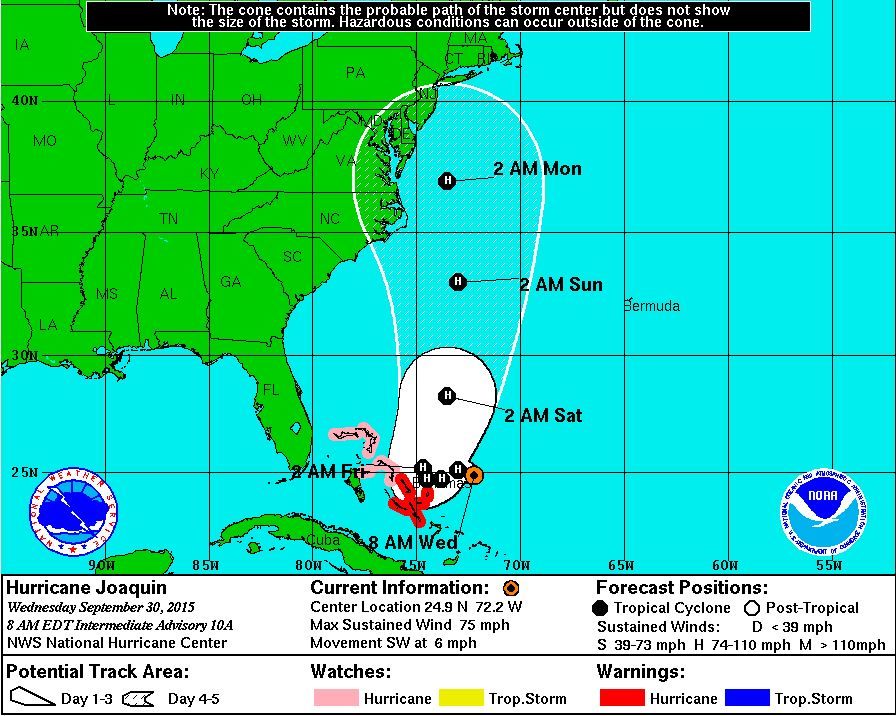
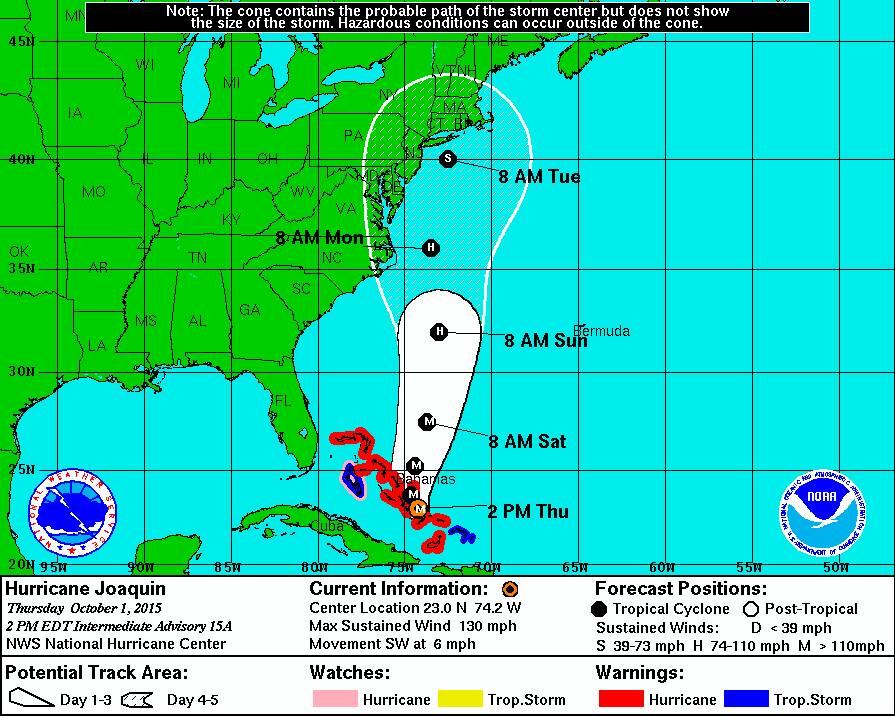
By September 29th, the NOAA Weather Prediction Center started to show a significant jump up in rain potentials for the East Coast as a result of so much model agreement. Some of this was tied into a possible track of Hurricane Joaquin to skirt the East Coast as it made the Westerly turn and was forecast to go north, likely missing land. No matter which way this was going to go, one thing was for sure in all the forecasts…heavy rain was coming.
This is an edited “surface map” to show the main elements setting up. Meanwhile, the mid to upper atmosphere is getting lined up for the negative tilt.
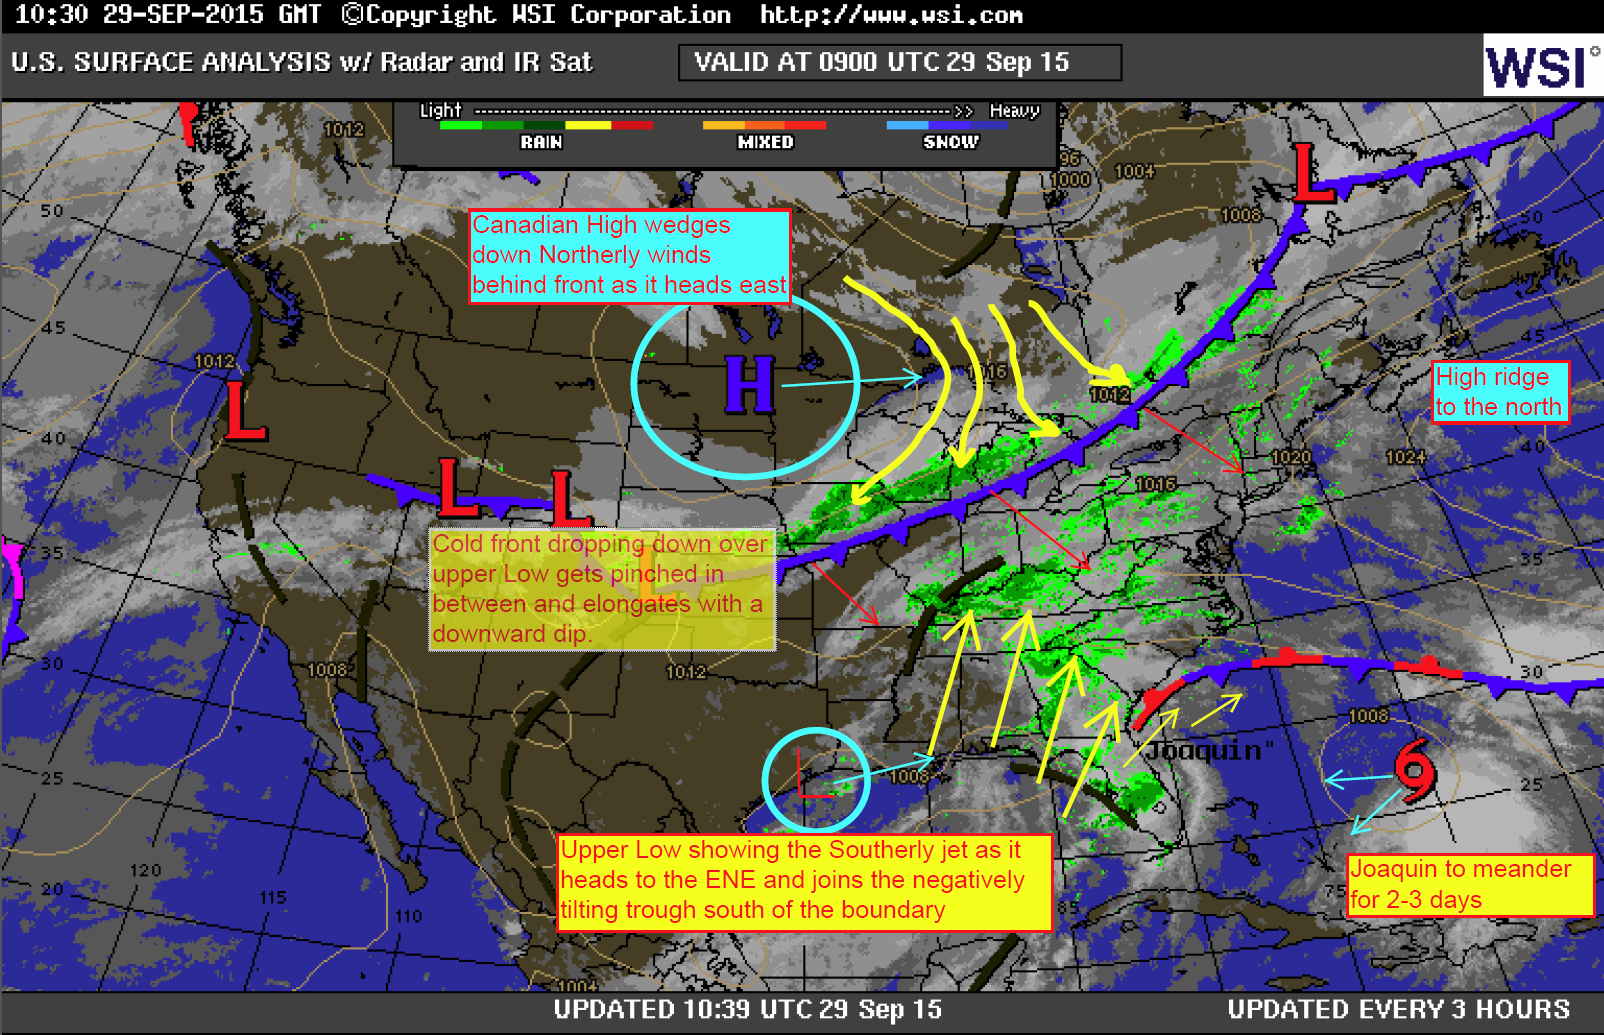
This is the 9/30/15 Surface Map – the recipe is starting to come together as High pressure to the north grows and strengthens, keeping the Low pressure to the south in check. The kink in the cold front is barely visible, but shown as a small area of rain at the surface. The warmer Low from the Gulf States has been stretched out as it was pulled into this front, giving additional energy to the upper colder Low trying to develop.
Also, In turn, NOAA WPC shifts their focus on the atmospheric river about to set up at the track from a now rapidly intensifying “Hurricane Joaquin”, which starts starts to align with the upstream in moisture. Rainfall amounts quickly shoot up several inches more. The swath of rainfall is still wide from the possible effects from Hurricane Joaquin drawing close by, but the higher rainfall potentials remain inland.
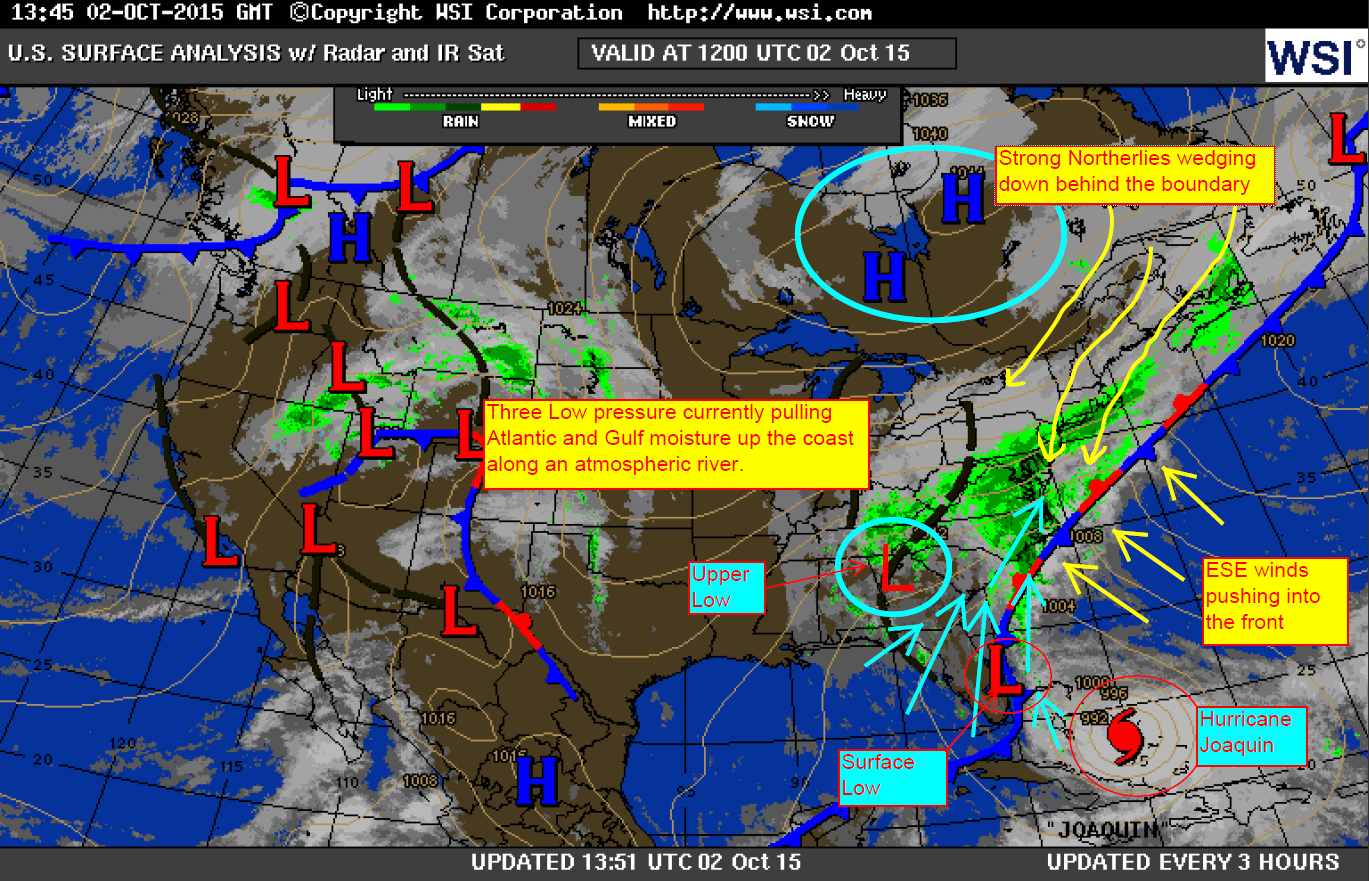
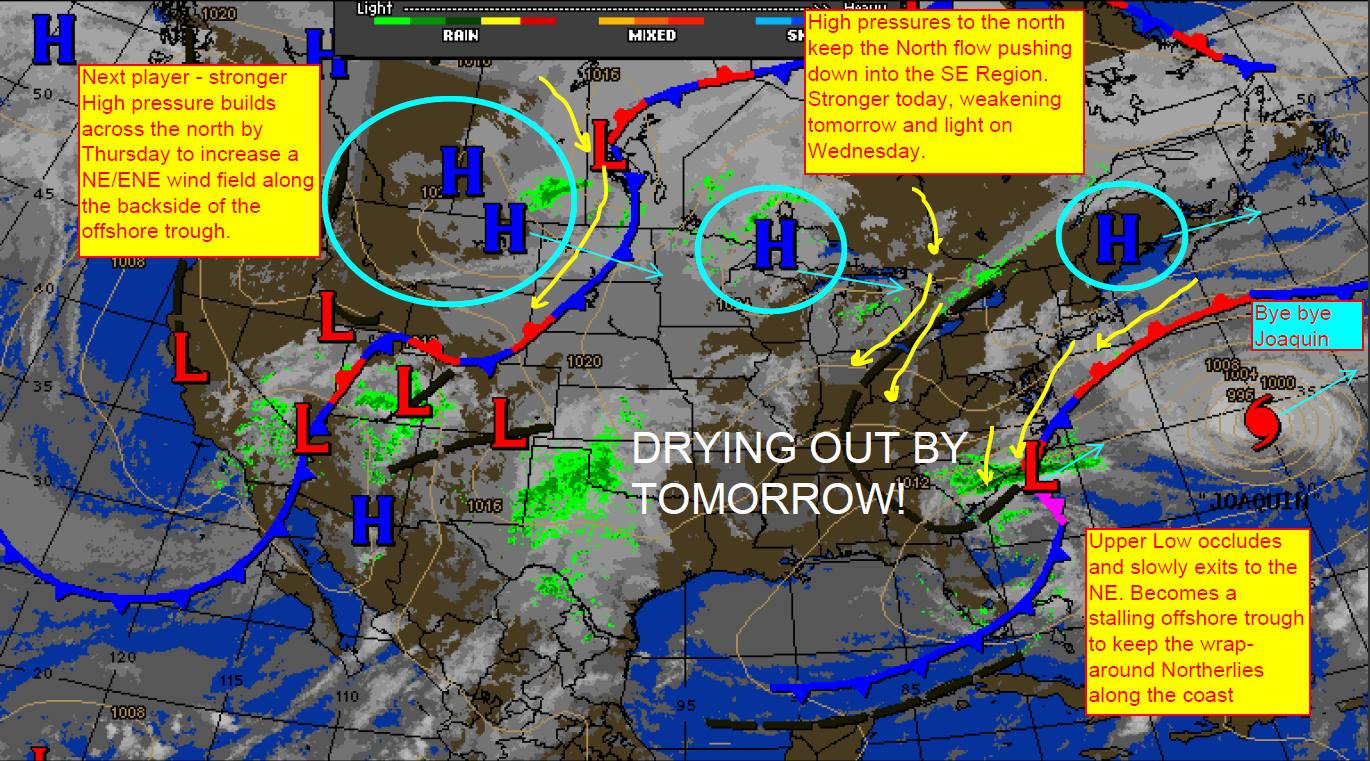
October 1, 2015. Upper to surface level High pressure was wedging down from the north with cool sinking air and increasing NE flow behind a stalling offshore cold front.
NOAA WPC increases the rainfall totals yet again as the upper Low lines up along the boundary.
A now Cat 3 Hurricane Joaquin’s track changes to a more Northerly path with a bit more emphasis on the EURO model’s trend to the NE.
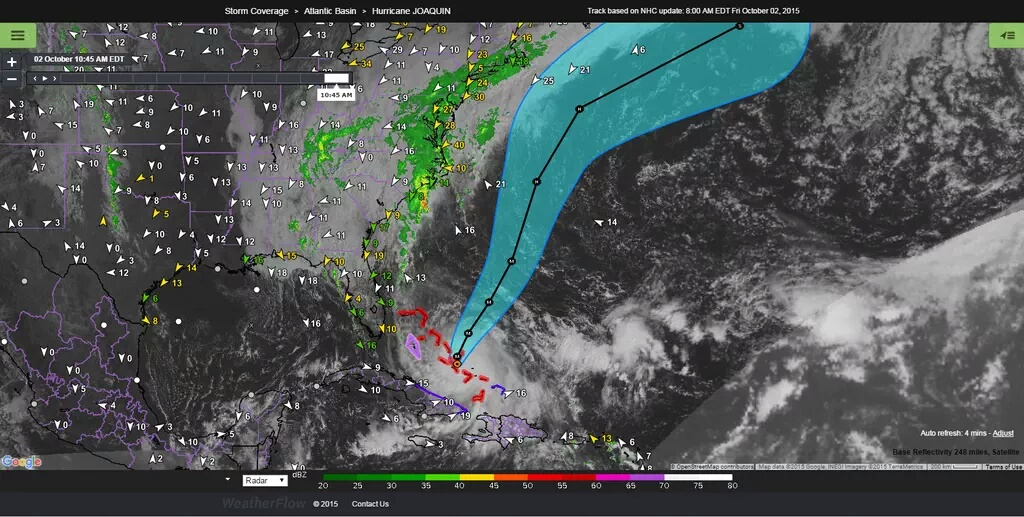
October 2, 2015. I went ahead and issued an article on the conditions as they began to worsen.
https://blog.weatherflow.com/hurricane-joaquin-11am-update-10215-for-charleston-sc-and-the-sc-coast/
Here’s the surface map. Things are getting ready to turn on.
The first round of rains come through and the tightening gradient starts to show – especially to the north of OBX.
October 3, 2015. Joaquin becomes a strong Category 4 of 155mph winds with outflow and divergence aloft maxing out.
Moisture along the outer fringes pushes into the point of origin along the river and the heavy rains begin to develop along a very distinct pathway.
Rainfall starts to increase significantly along the plume.
NOAA WPC issues another rainfall total with the focus remaining narrowed down specifically over SC:
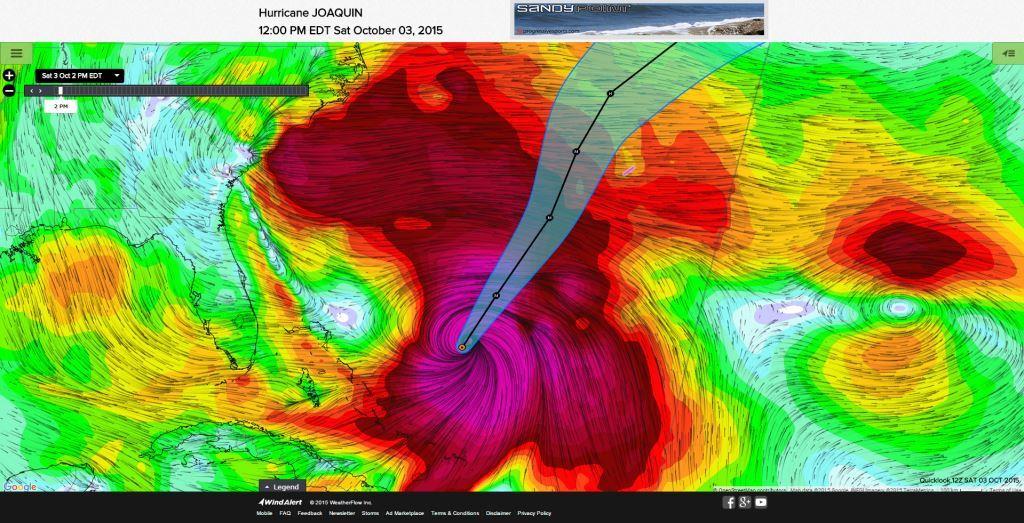
Our Wind Alert StormTrack “FlowViz” feature shows the connection between all 3 low pressure systems along the Easterly surface winds and the forced upper atmospheric moisture feed up the trough, which is that light blue line running up into southern SC.
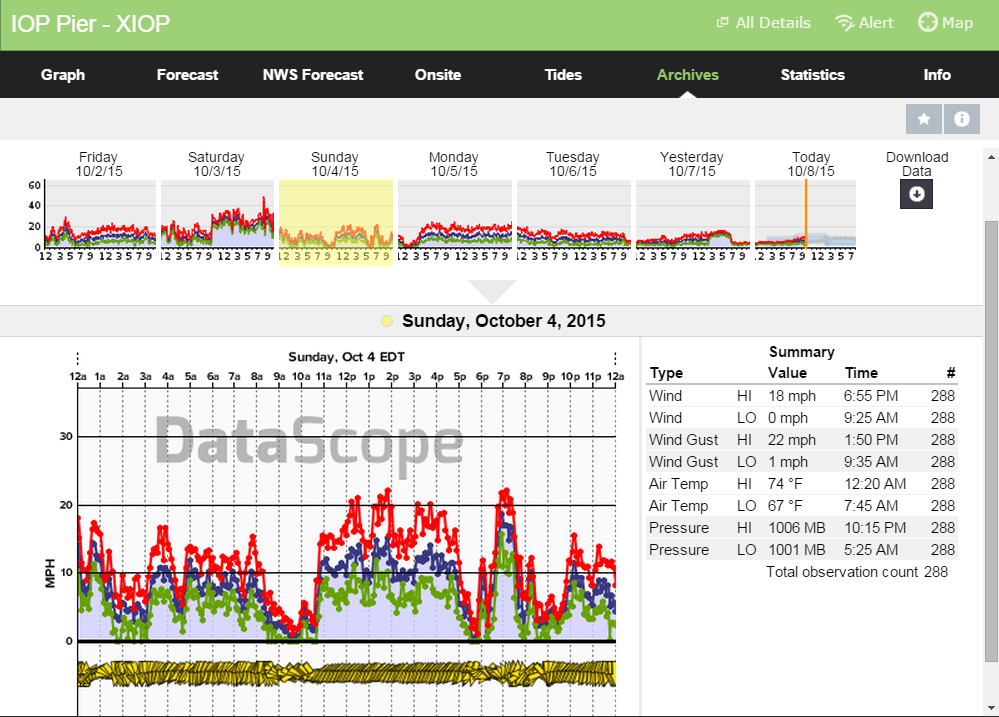
Winds crank up into the 44-52mph ranges in the Charleston area as storm lines and convections spike the wind field.
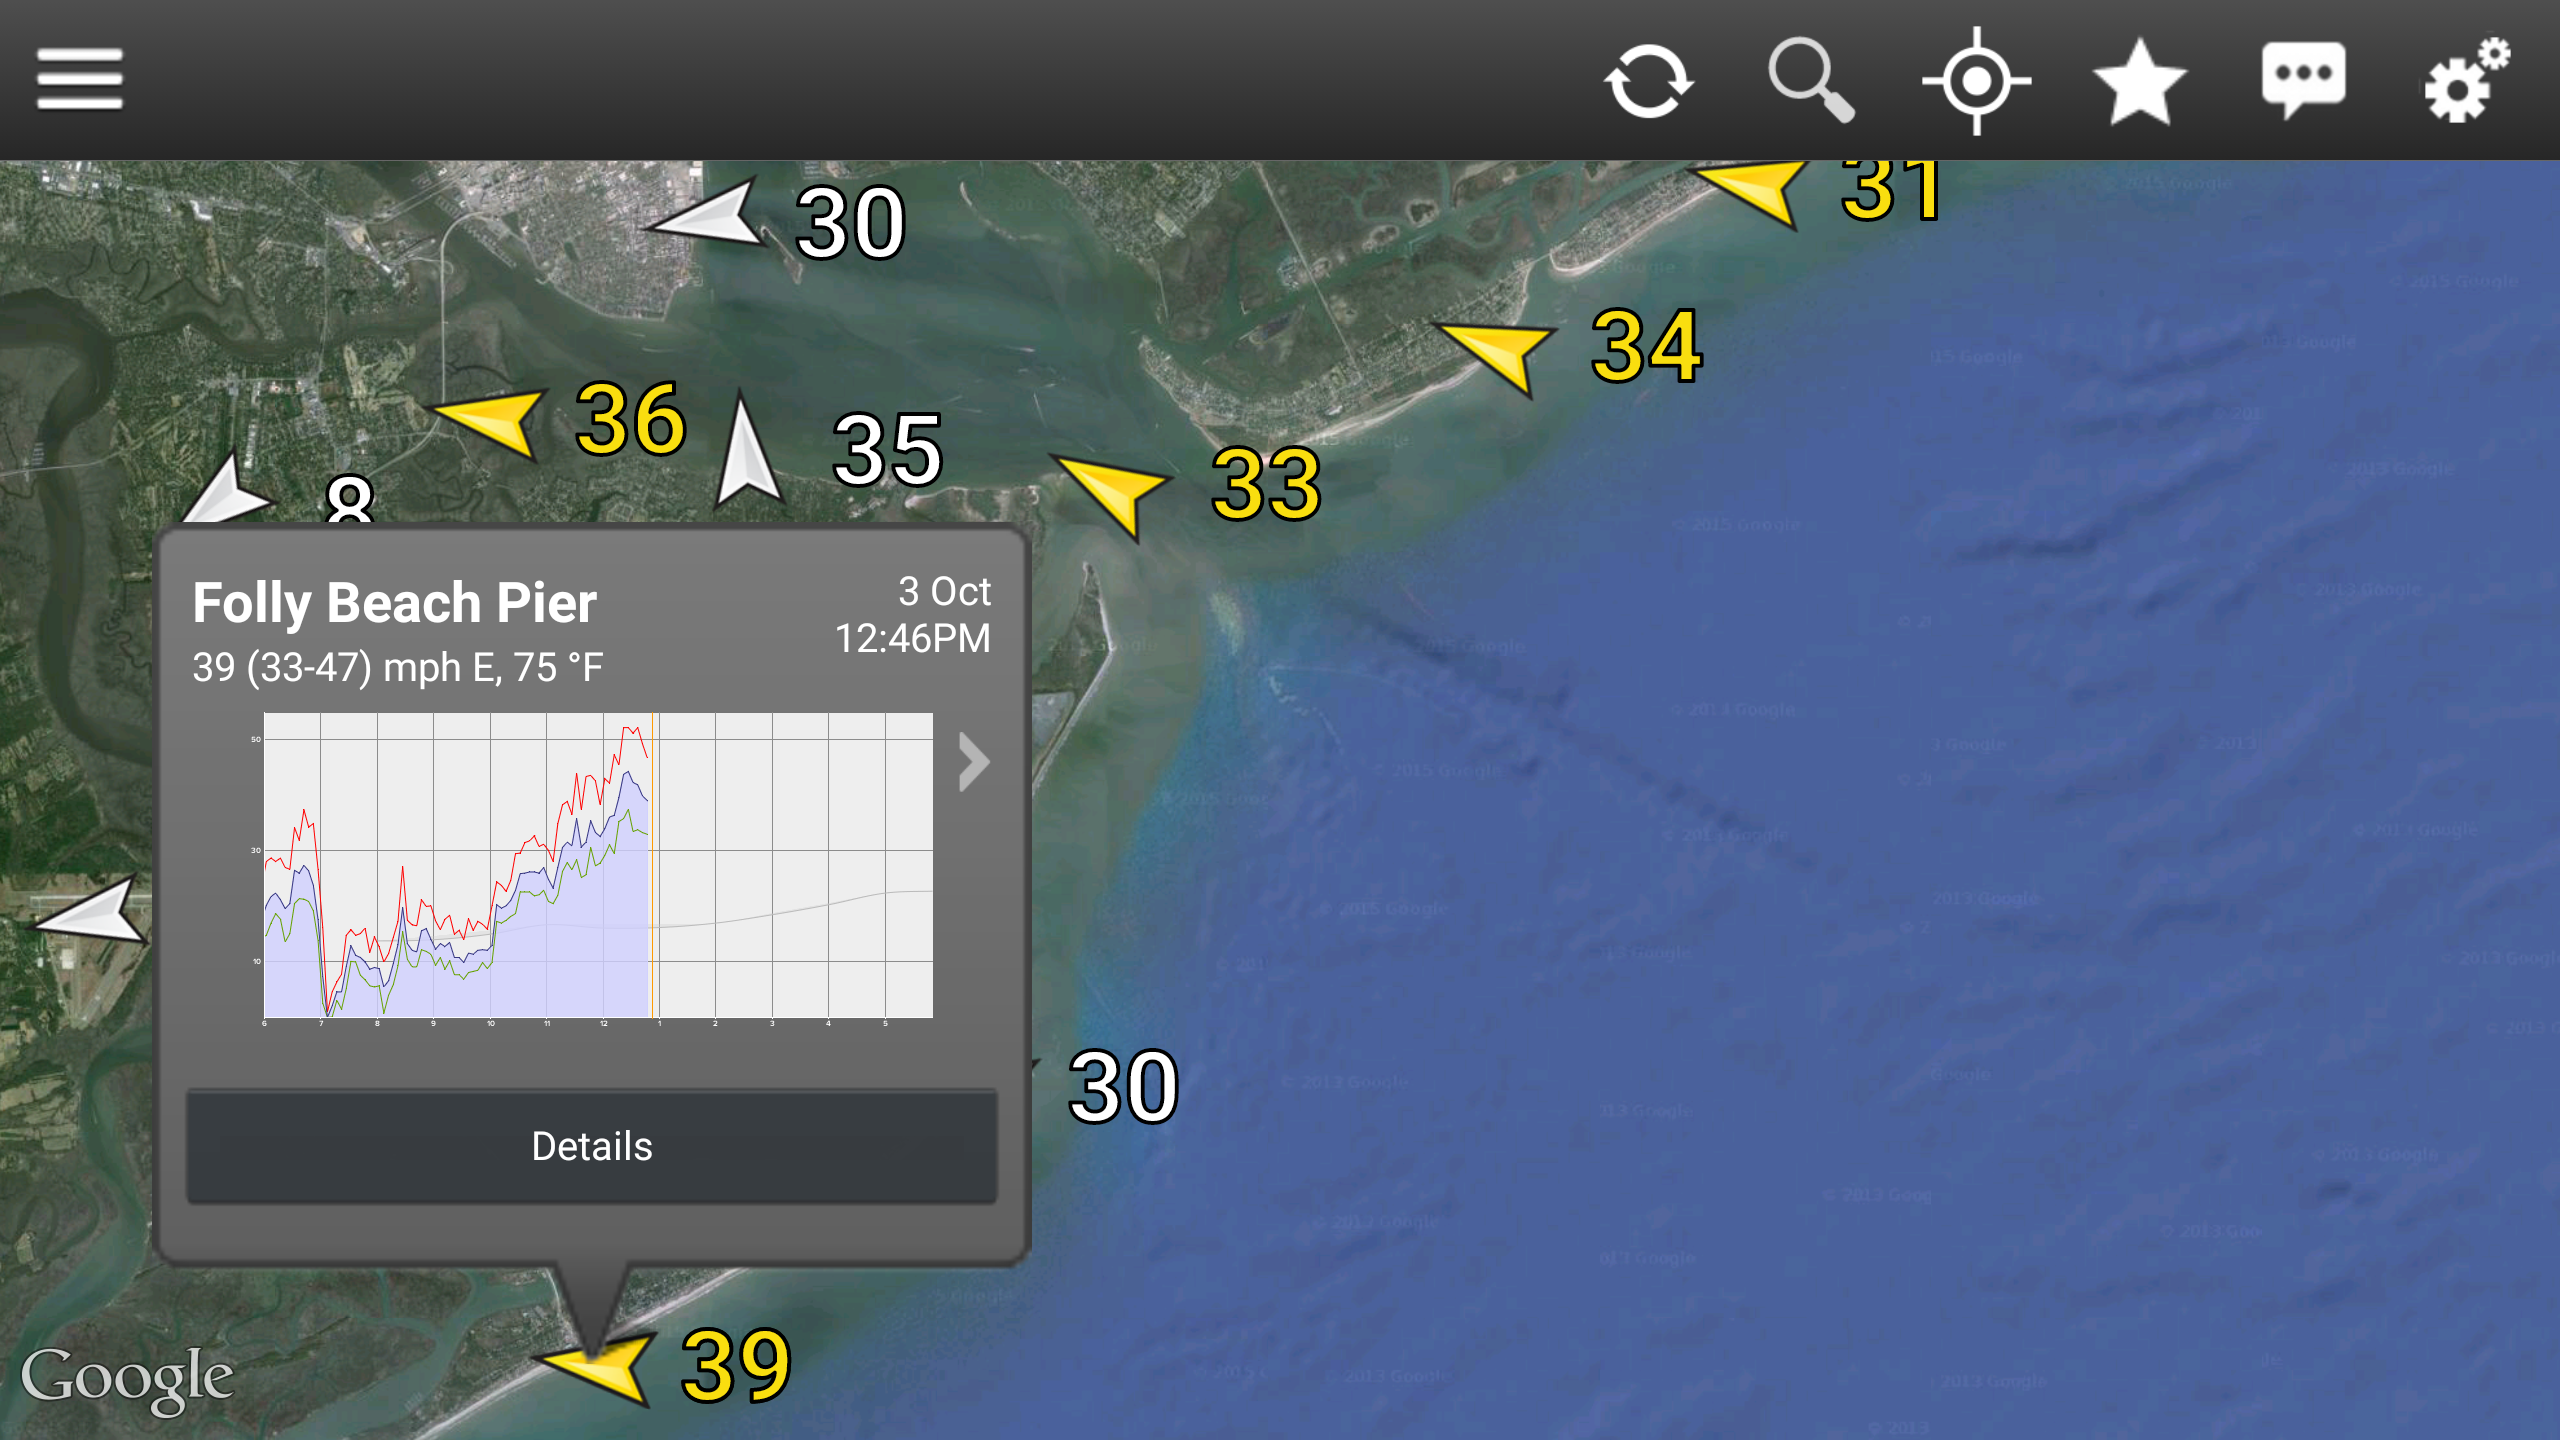
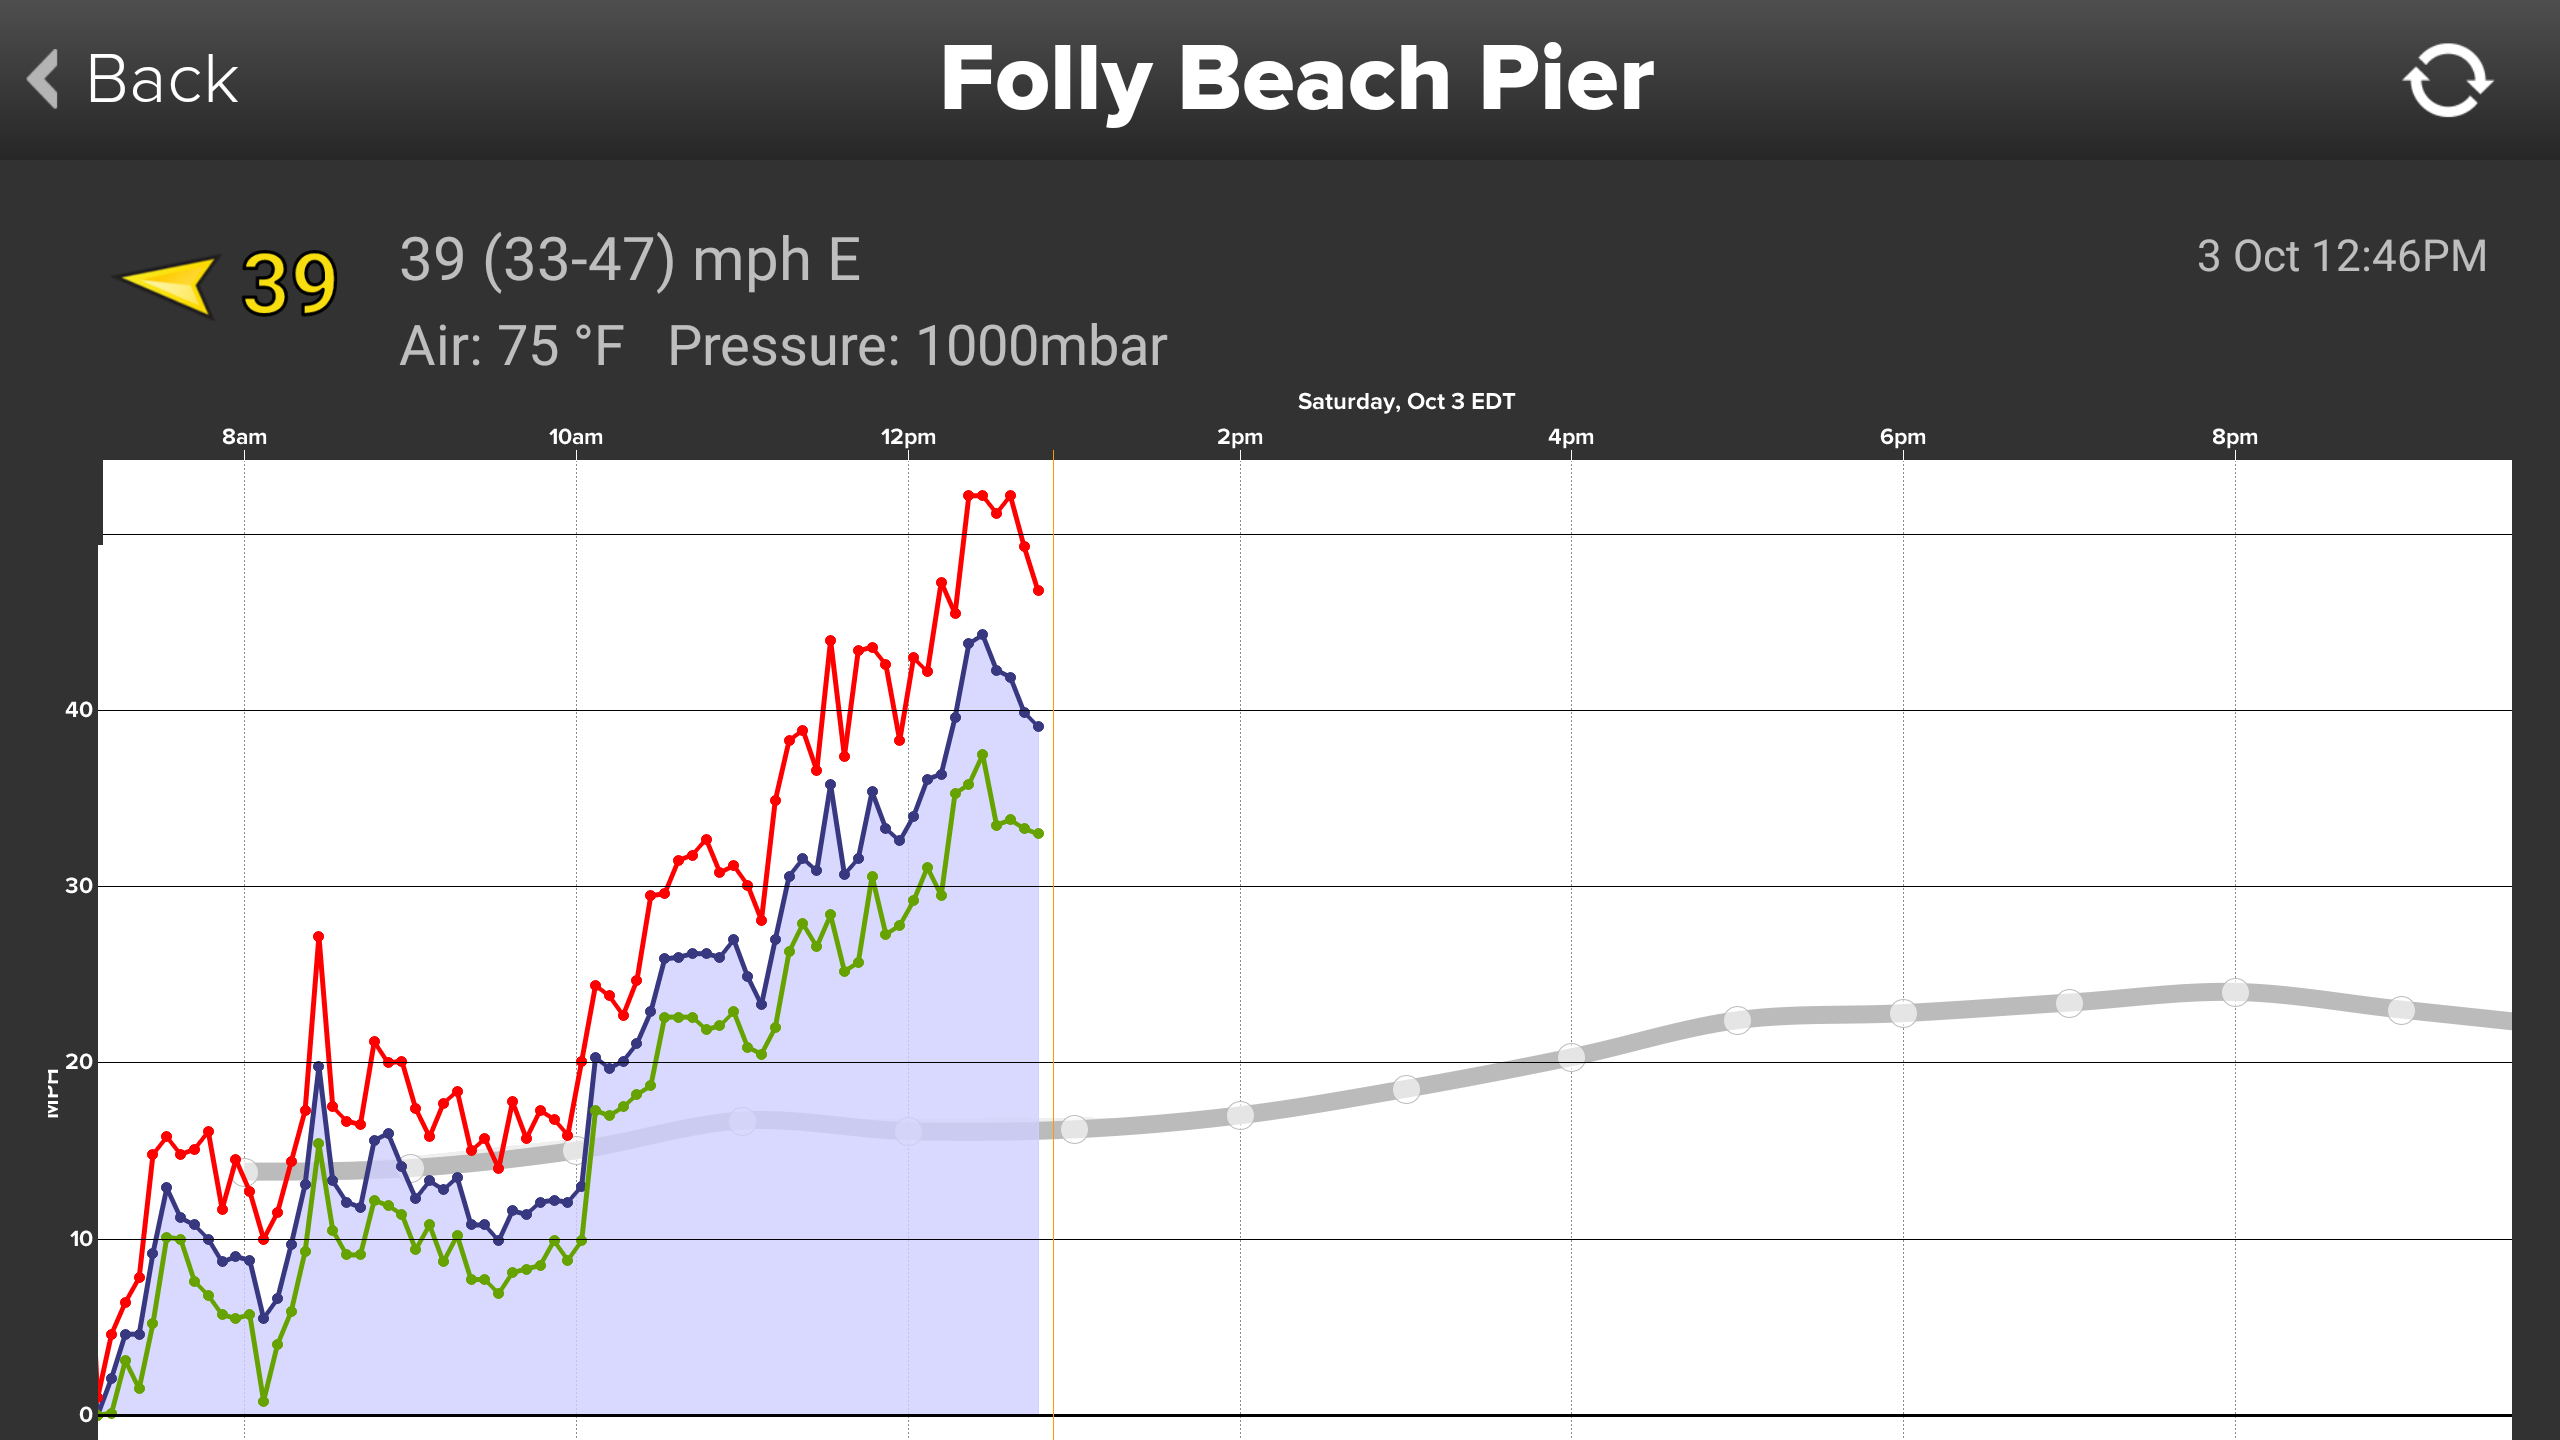
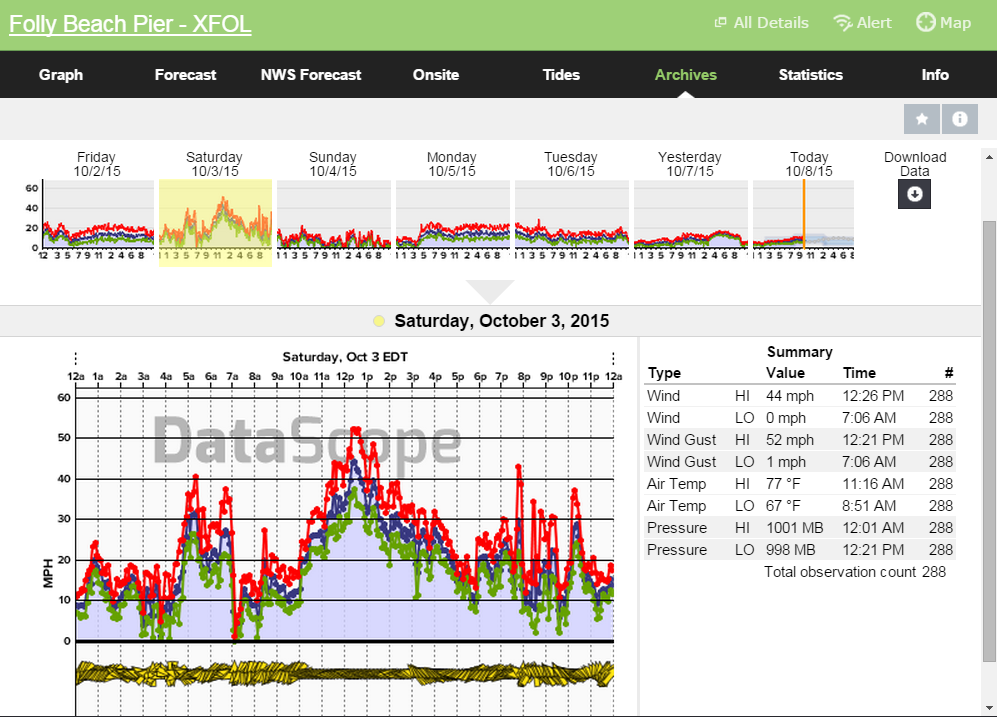
Here is the entire daily graph for Folly Beach – note that each high spike of shifty wind is an area of convection or fast moving storm event:
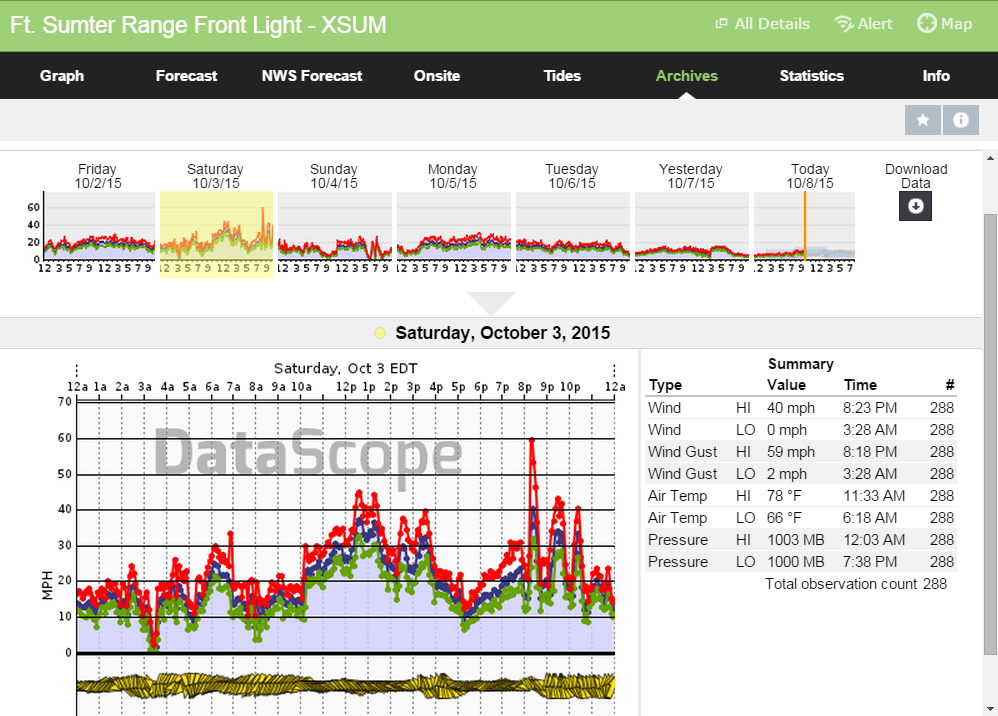
And the Charleston Harbor at Fort Sumter, which saw straight-line winds meet 59mph just after 8pm from another fast moving line of thunderstorms:
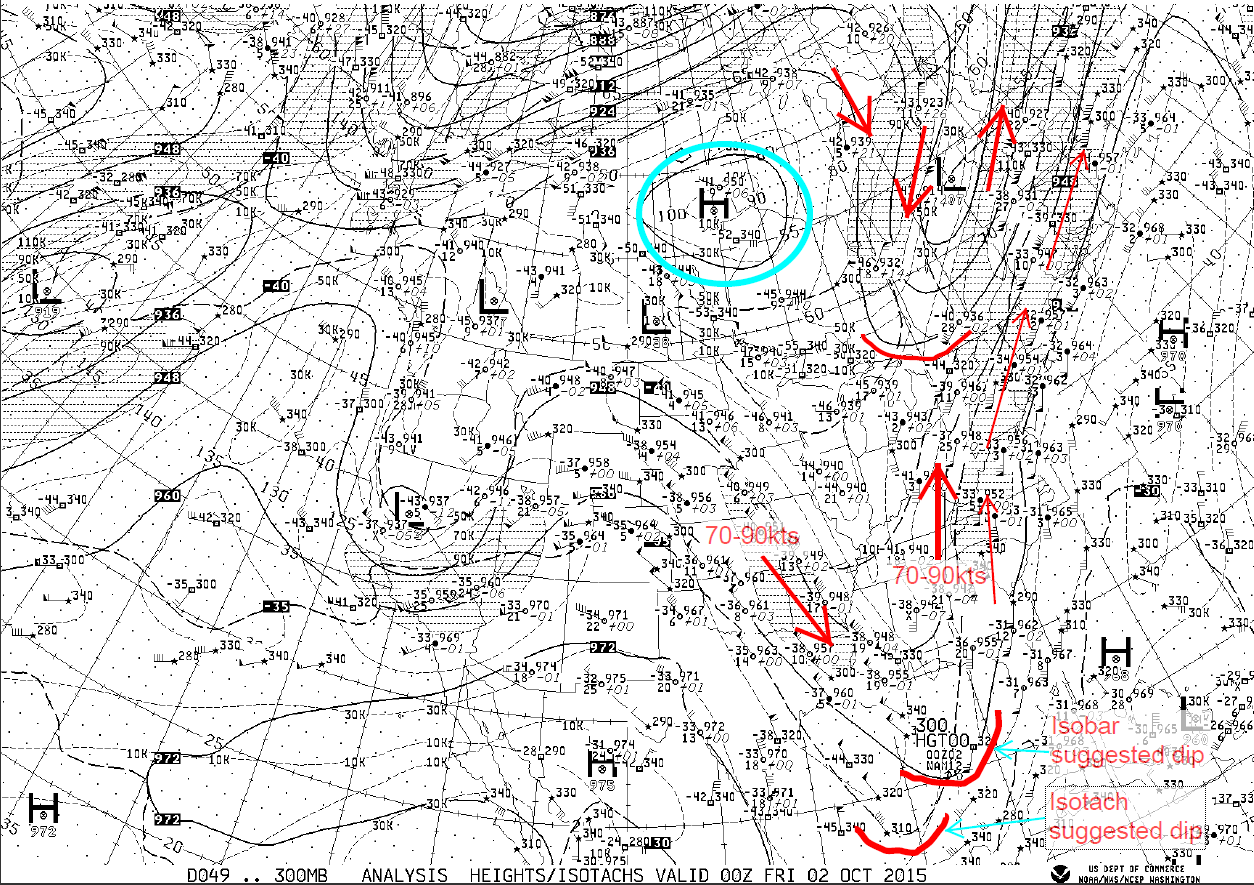
Here is a snapshot of the atmosphere at 300mb, or ~30,000 feet up.
October 4, 2015.
Joaquin weakens back to a Cat 3 and track takes it to the NE.
Heavy rains continue. Heavy bands start to line up just north of Charleston into Georgetown, the Grand Strand and SE North Carolina. Smaller bands continue to bring showers to the south. 
NOAA WPC issues next rainfall predictions:
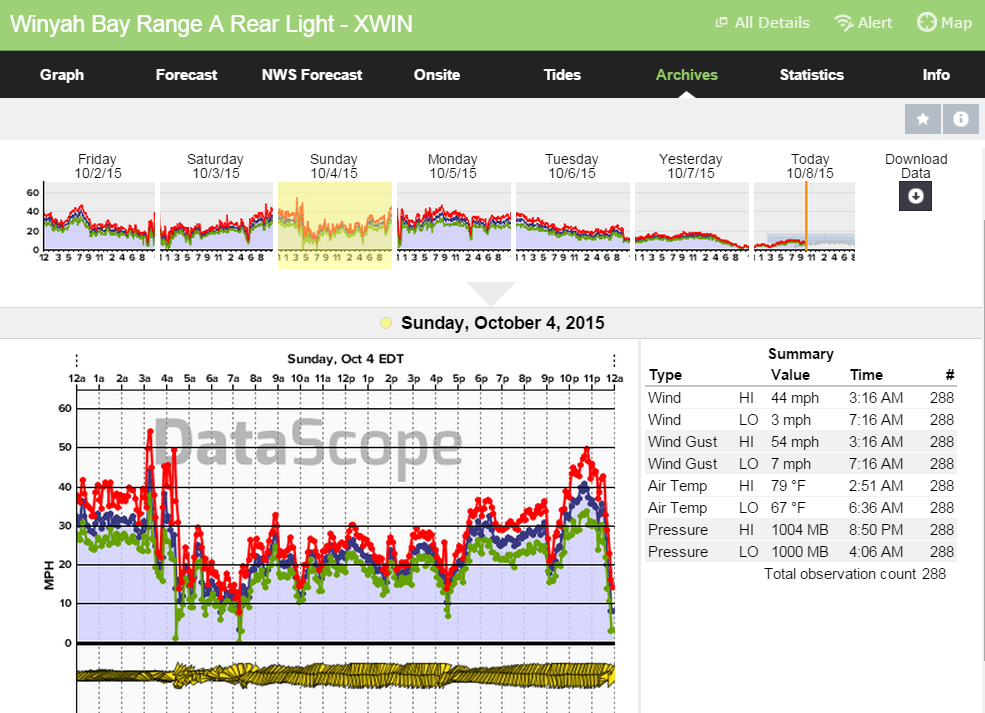
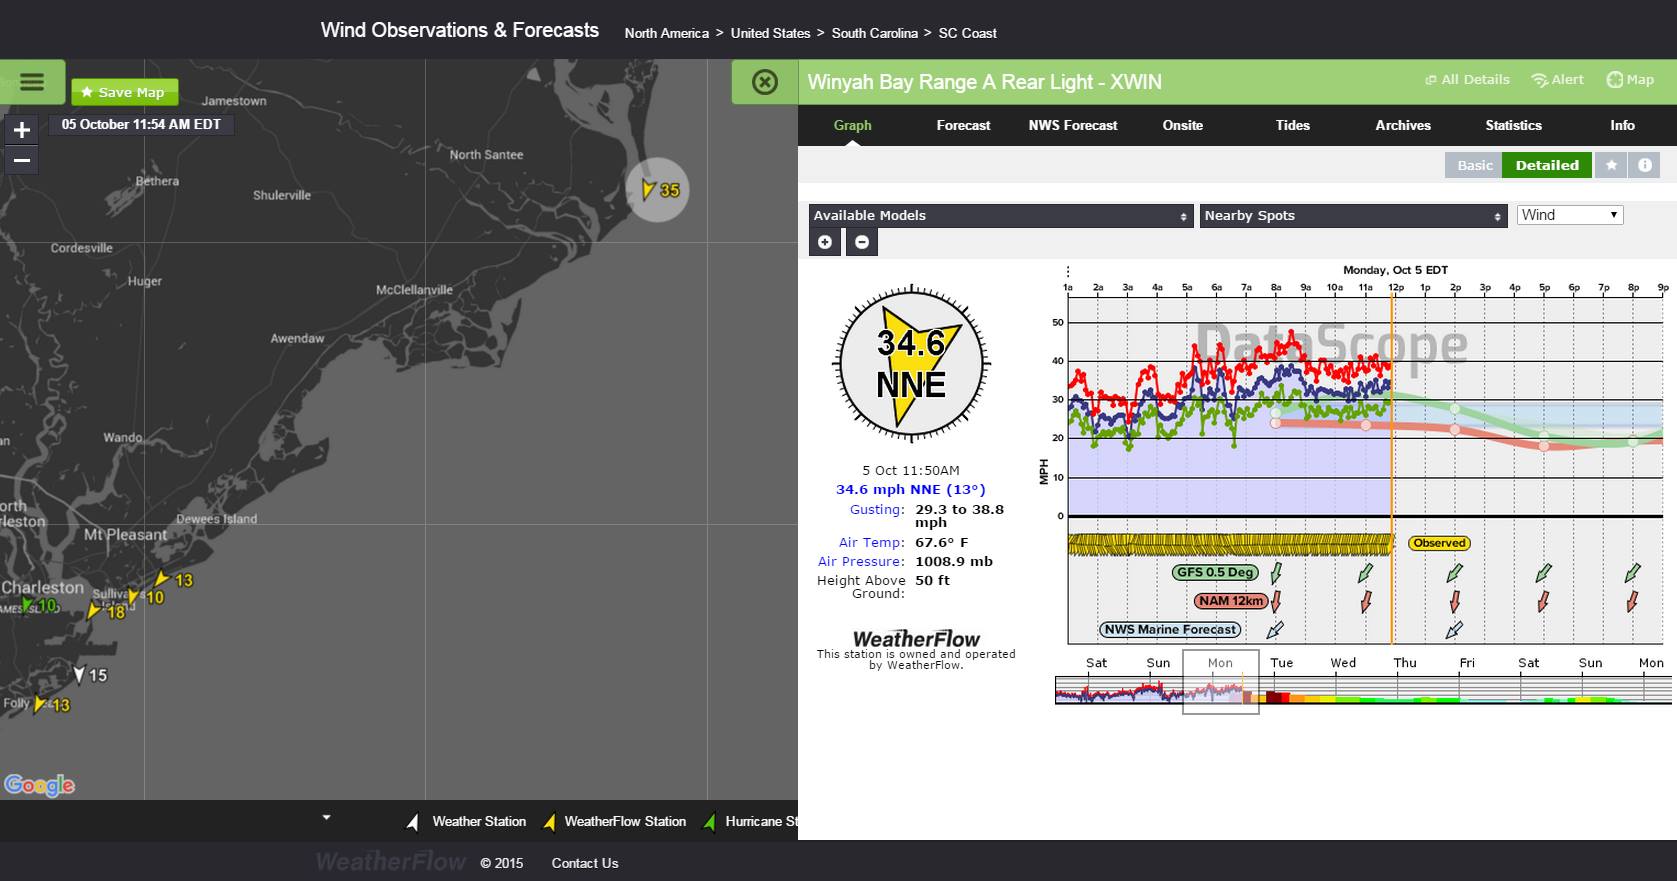
Winds start to relax over Charleston, remain stronger from Winyah Bay and northwards.
Winyah Bay:
Here’s the upper Low closing off.

October 5, 2015.
The upper low pulls away from the coast, with heavier rains still coming ashore SENC, and ending in SC.
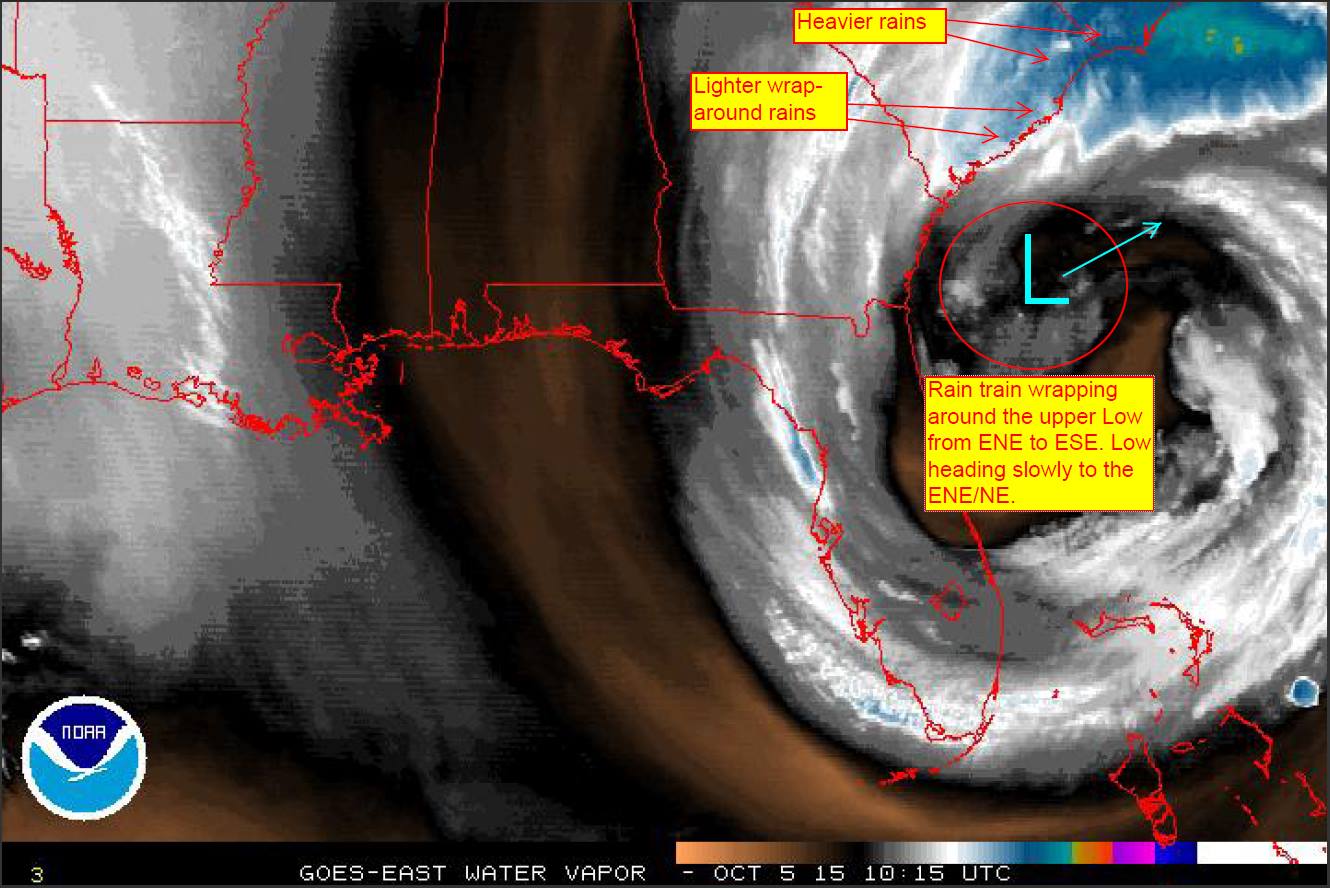
Wind stays strong 60 miles north of Charleston and up into NC along the continued strong gradient.
***This is pretty much the end of the event by evening hours as the moisture cut off from the south.****
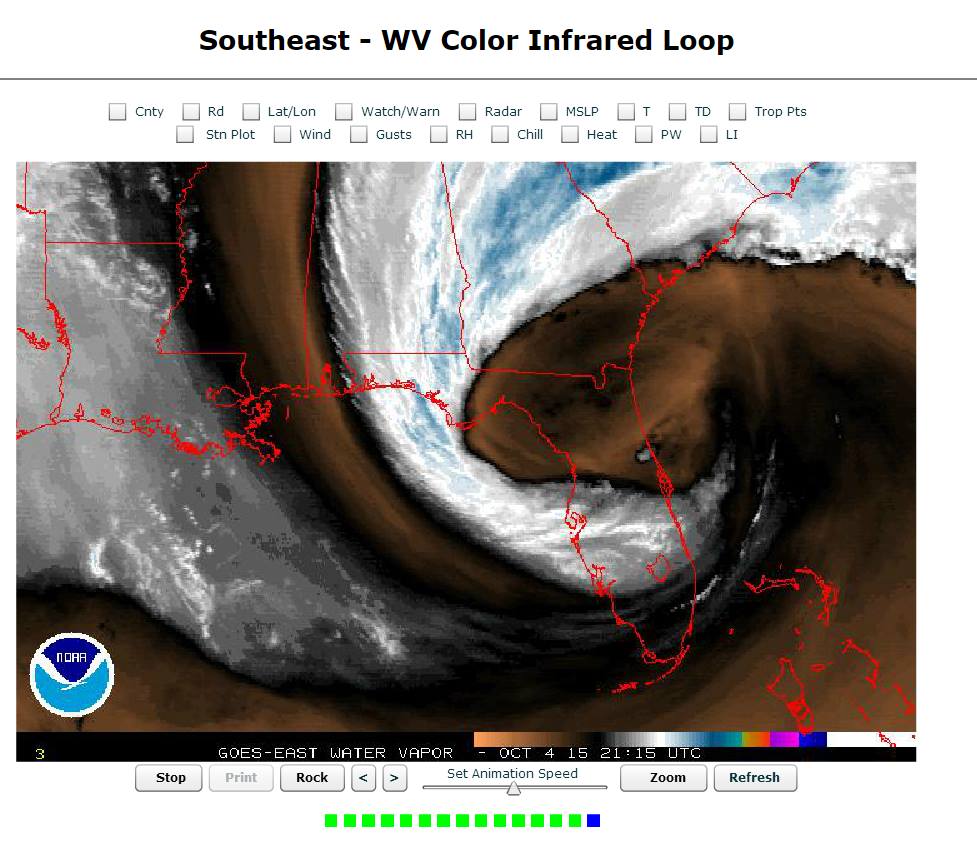
Here is a 4 day loop of what looks like a hose that was turned on over the state. Increase the HD for clearer view.
Here is a larger and slowed down version of this: http://cimss.ssec.wisc.edu/goes/blog/wp-content/uploads/2015/09/1000x1600_AGOES13_B3_SC_FLOODINGWV_animated_2015274_004500_180_2015278_144500_180_WVCOLOR35.gif
And the “rain train”. Again increase the HD for a clearer view.
Radar loop over SC from Oct 1- 5 with 10 minute increments.
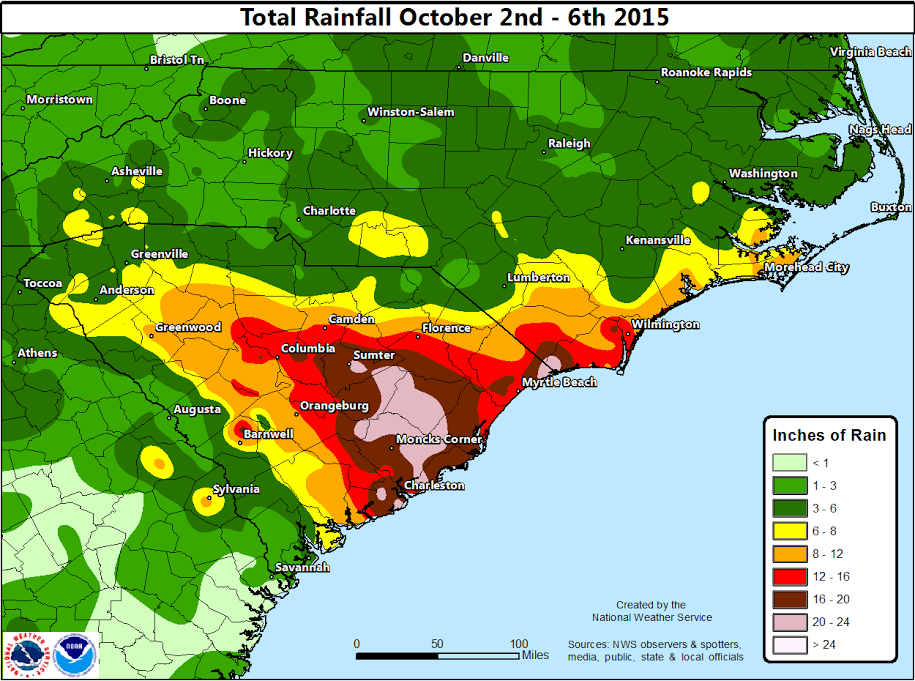
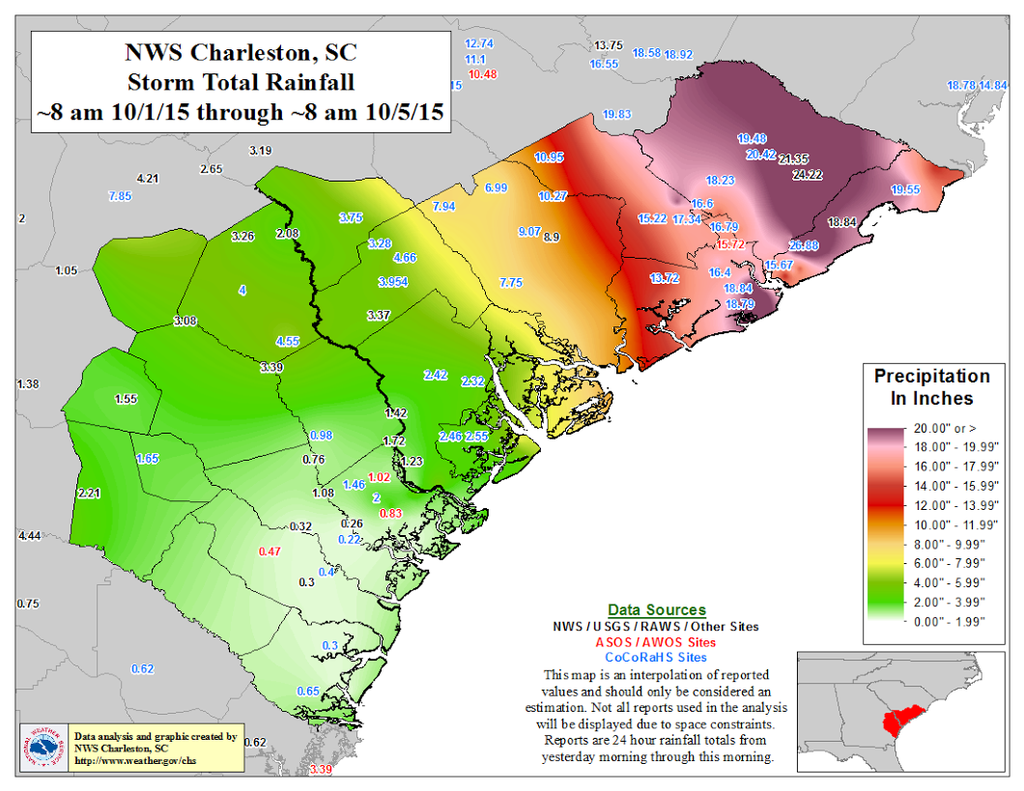
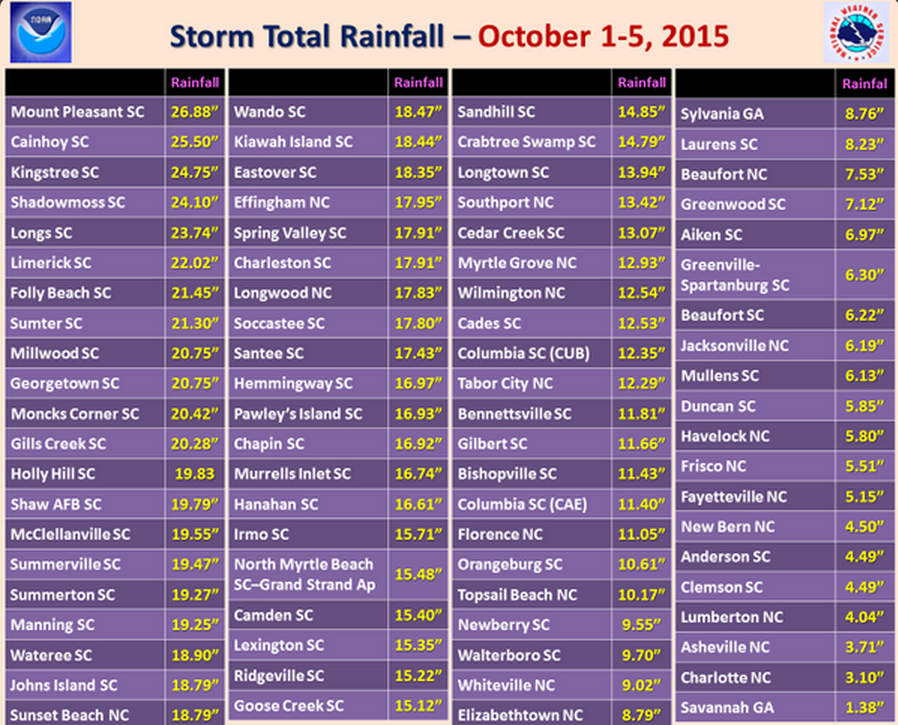
Total rainfall amounts. Mt. Pleasant, SC saw the highest at 26.88 inches. Widespread damage all over the state from flooding. The Columbia, SC area an other midlands have seen quite a bit of damage, road closures (including interstates) and total washouts.

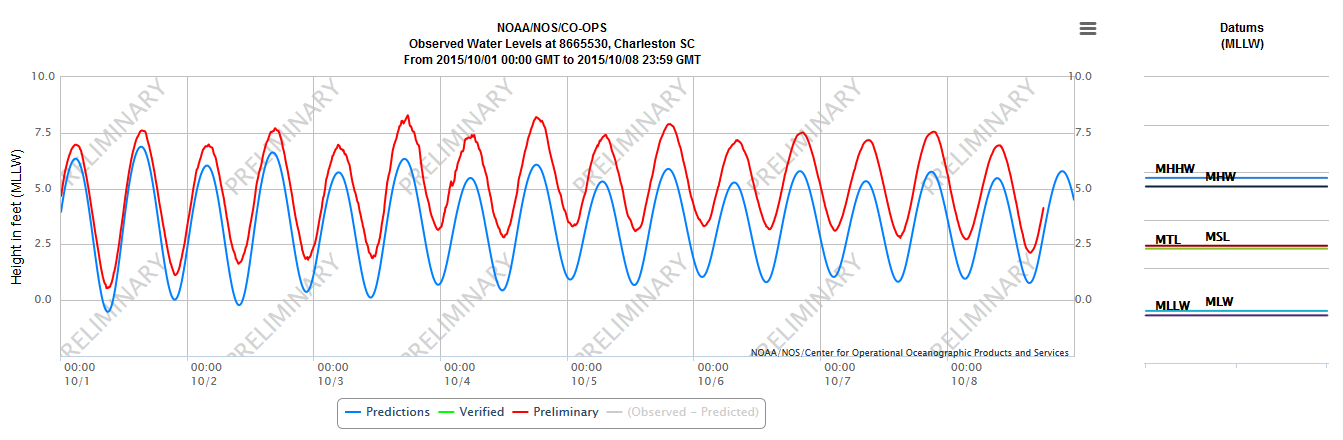
From the NWS Charleston on High tides during this event:
“Recent perigean spring tides combined with persistent onshore winds to produce very high tide levels along the South Carolina and Georgia coasts. Such high tides exacerbated the freshwater flooding from the heavy rainfall and led to significant flooding of properties and roads, especially in downtown Charleston. In fact, tide levels peaked at 8.29 feet Mean Lower Low Water (MLLW) in Charleston Harbor at 142 PM EDT on October 3. The chart below shows the observed water levels (red) compared to astronomical (normal) tide levels (blue) at the Charleston Harbor tide gauge from October 1 through October 8. Note the significant tidal departures through the entire period.”
The total estimates originally stated 4.4 trillion gallons of water fell from the sky. Rumored now to be 11 trillion gallons from unofficial sources.
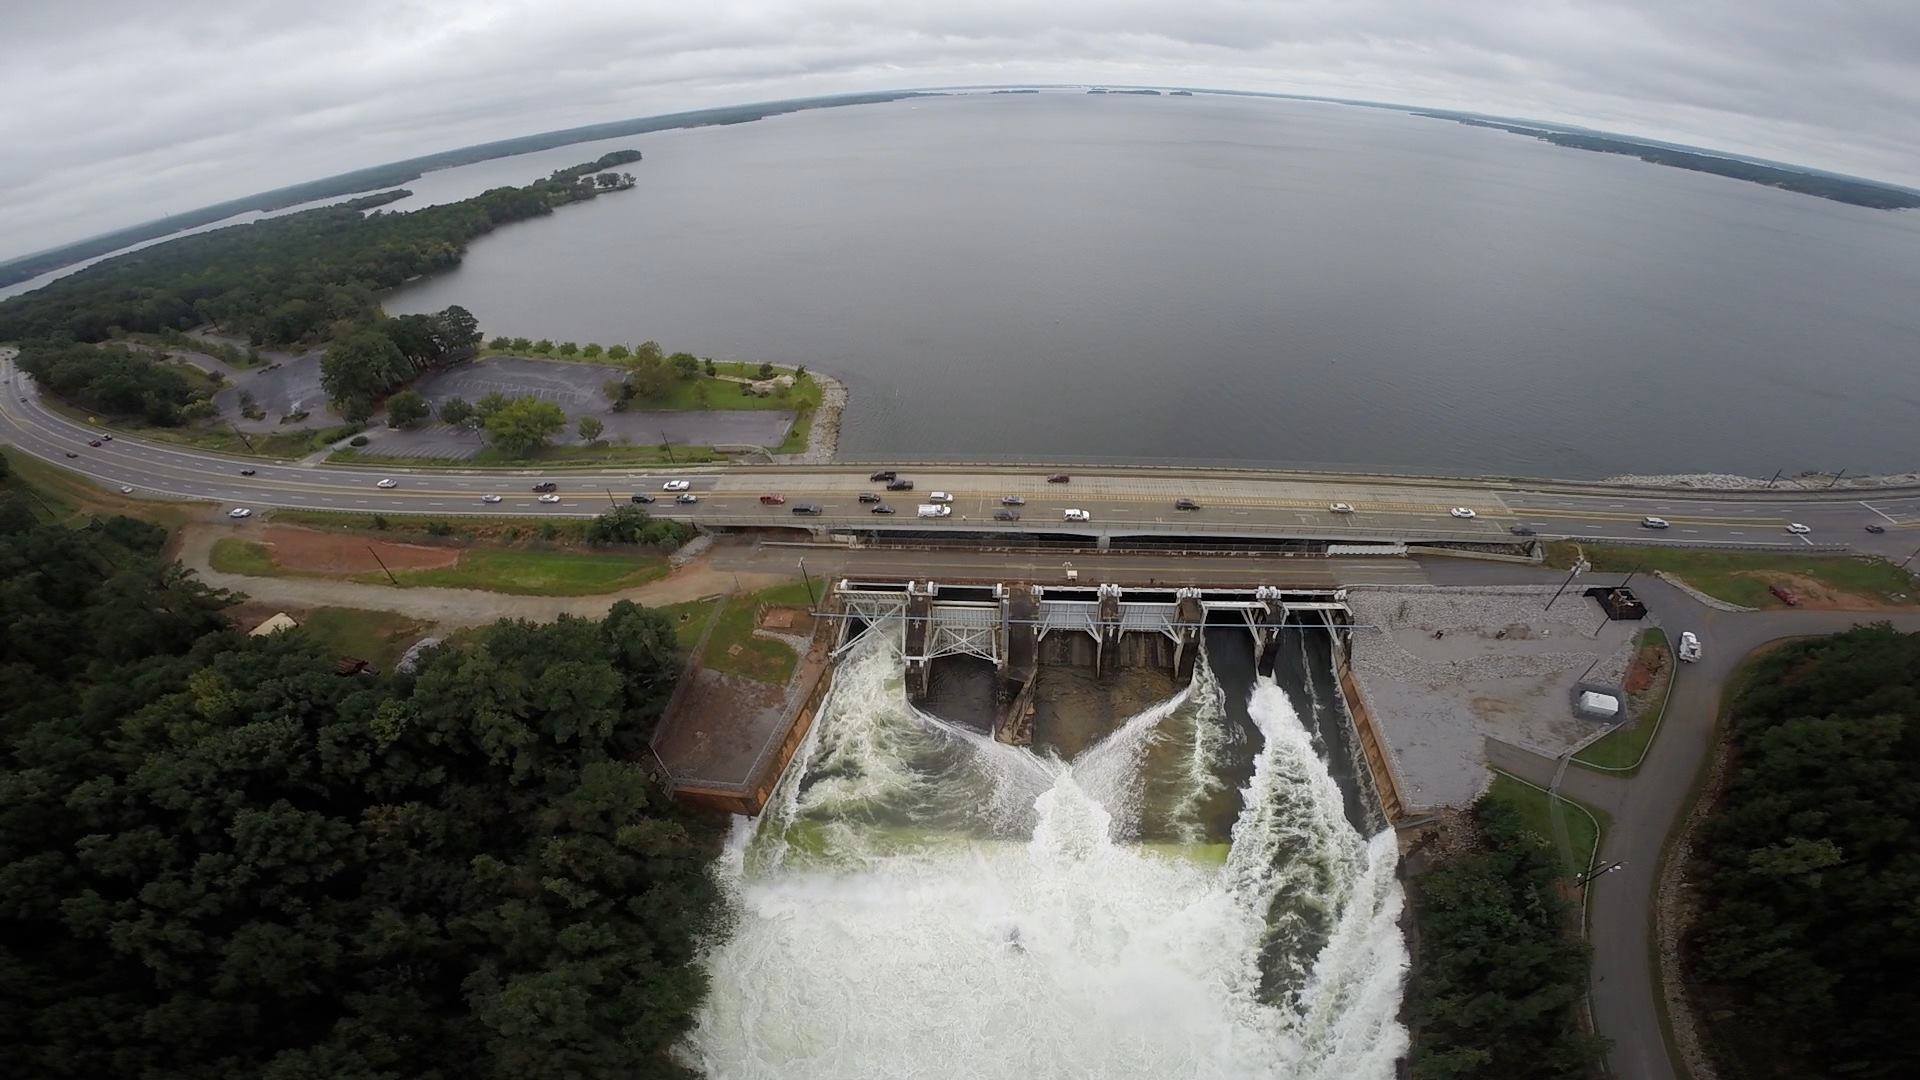
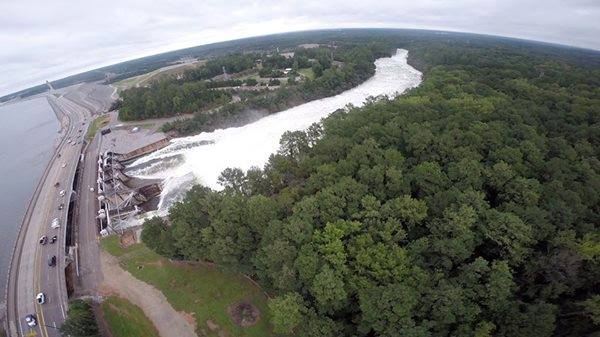
13 dams have broken and 1 was forced to open the spillway for the first time since 1969 (built in 1930):
Lake Murray Dam Spillway / Saluda Dam
Flooding is now the main concern as we continue to recover from this event.
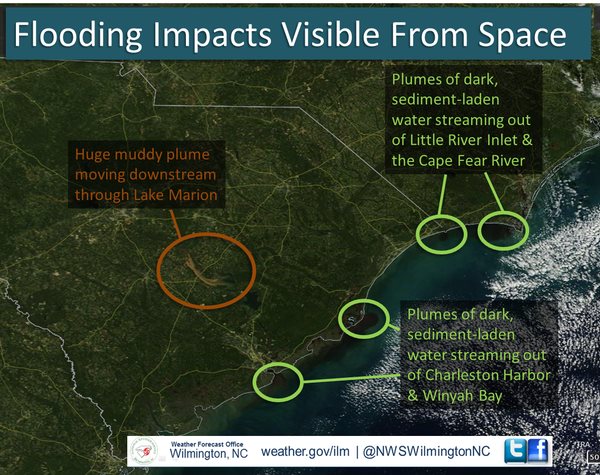
NASA’s Terra satellite captured this image of historic flooding reaching the Carolina coast. Our coastal water salinity/brackish mixture as well as sedimentary properties will be changed for some time.
The SC Department of Health and Environmental Control (DHEC) has temporarily closed most of the state’s shellfish grounds — everything between the North Carolina border south to St. Helena Sound — as a precautionary measure after the recent rainfall events.
Significant rainfall flushes contaminants from roads, roofs, and other surfaces into local waterways, triggering high bacterial levels in the water. Because shellfish such as oysters and clams are filter feeders, bacteria and other disease-causing organisms can become concentrated in their tissue and are not safe for humans to eat.
Stay safe everyone.
Shea Gibson
WeatherFlow Forecast Team
SE Region/ East Coast
Twitter: @WeatherFlowCHAS
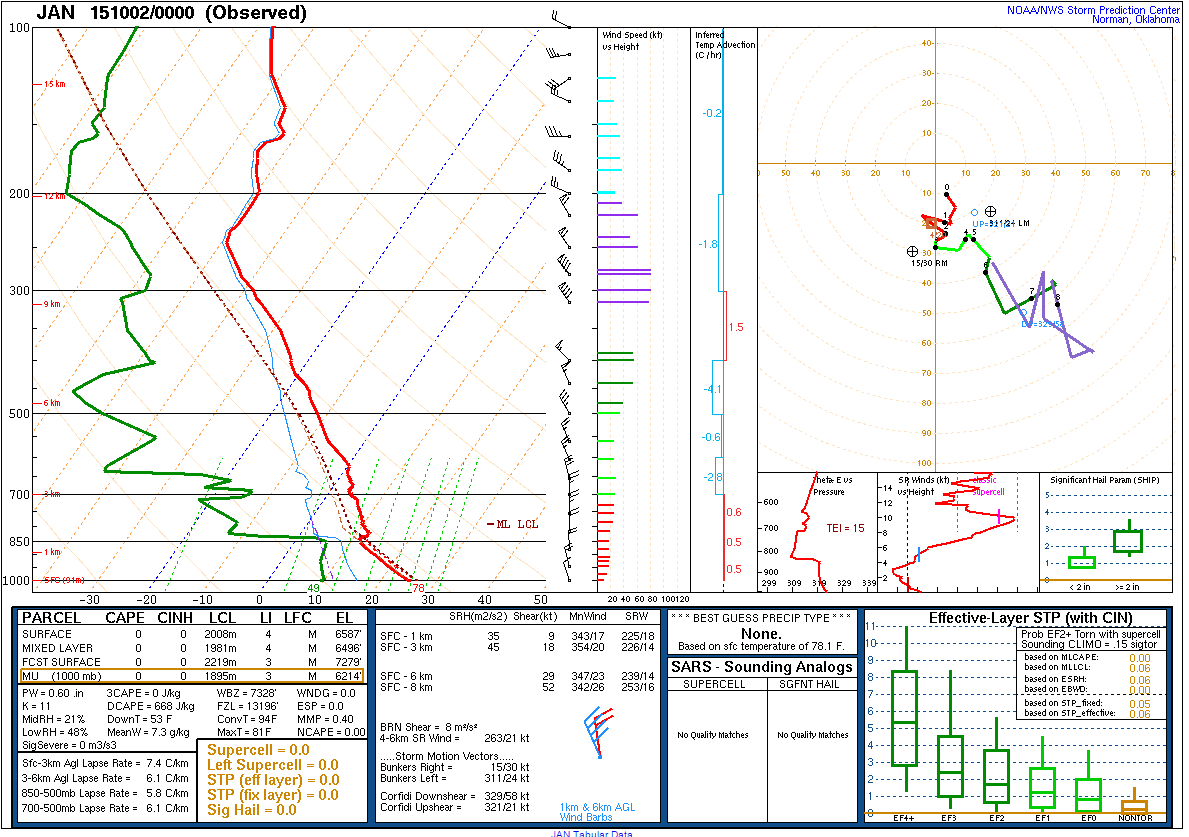
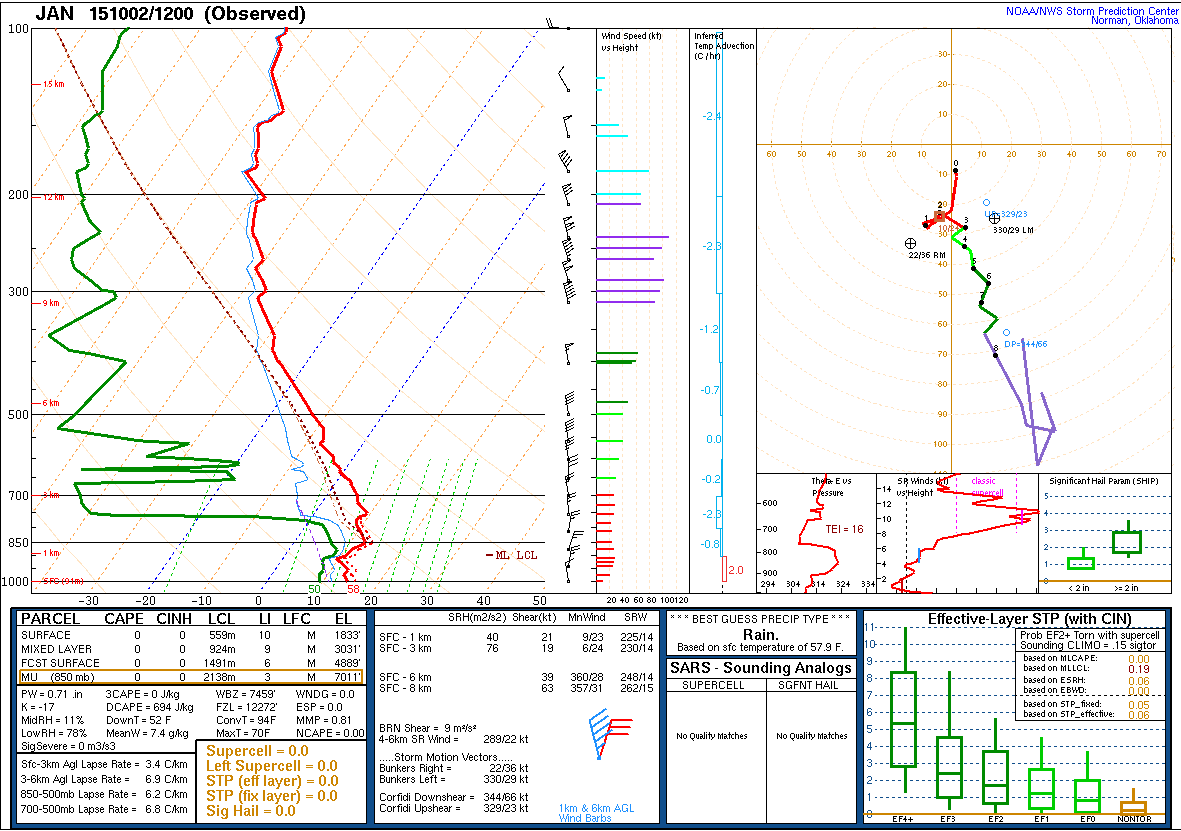
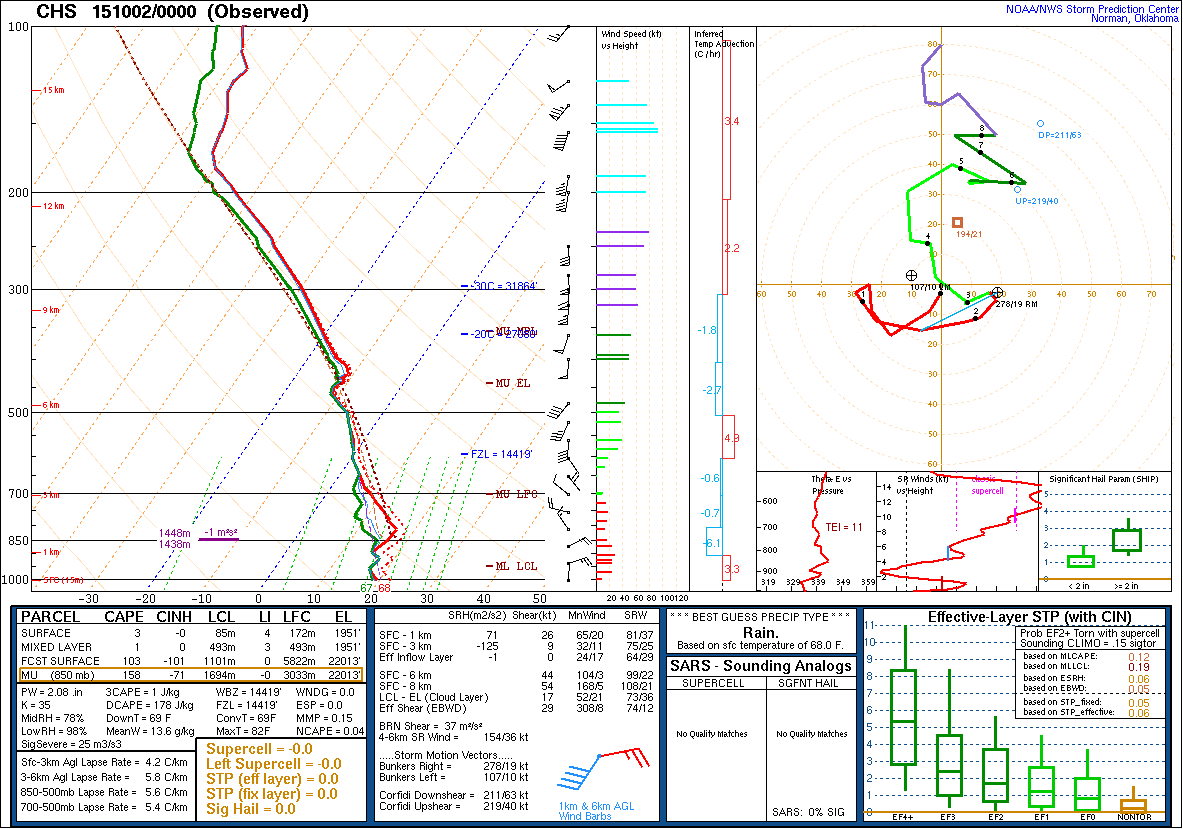
P.S. Here are a couple of skew-T’s from October 1st (7pm) and 2nd (7am) from Jackson, MI….and one from Charleston on October 1st at 8pm. If you know how to read these, you’ll see the huge differences in upper air winds and moisture. Both from either side of the upper Low.