by WeatherFlow meteorologist Shea Gibson.
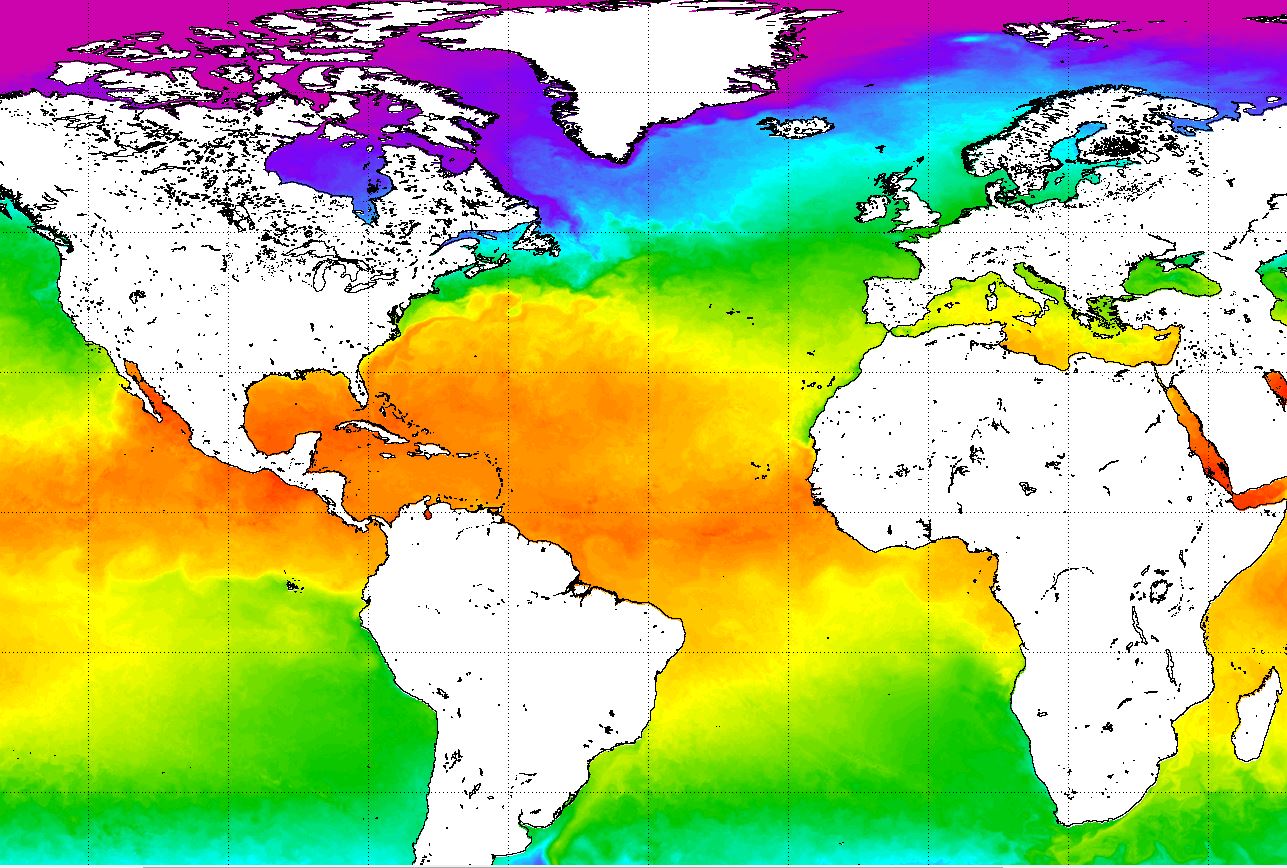
As a quick recap, The Intertropical Convergence Zone where tropical storms form, or the “ITCZ”, is heavily impacted by the Saharan Air Layer (or “SAL”), which is a dust layer off the western African coast along the lower and mid levels of the atmosphere. This dry, dusty more stable air rides just over the northern ITCZ boundary and weakens the cyclogenesis process – in other words…dissipates formation of convective storms around the centers of Low pressures stages early on. Moisture contents have been low for feeding into potential candidates due to such dry conditions. This coupled with a few areas of mid/upper level shearing environments and below normal Tropical Atlantic sea surface temps, we have seen a fairly quiet year in the Northern Atlantic.
For SAL-ty Atlantic Part I of this series, please see: https://blog.weatherflow.com/sal-ty-atlantic-the-saharan-air-layer/
For SAL-ty Atlantic Part II of this series, please see: https://blog.weatherflow.com/sal-ty-atlantic-the-saharan-air-layer-part-ii/
The peak Atlantic Hurricane season for 2014 is starting to wind down and we have seen 5 named storms: CAT 2 Hurricane Arthur (100mph – 973mb) which formed off the SE coast and made landfall over coastal NC. Then there was Cat 1 Hurricane Bertha (80mph – 998mb) which barely stumbled out the ITCZ (Intertropical Convergence Zone) gasping for moisture, crossed the Lesser Antilles/Puerto Rico/Dominican Republic/ Turks and Caicos, and curved up towards the SE coast and hooked away from land. Then Cat 1 Cristobal (85mph – 970mb), which struggled through the Saharan Air Layer to recurve out to sea as well. Surprisingly only one from the Gulf of Mexico, this one specifically from the Bay of Campeche, was Tropical Storm Dolly (50mph – 1002mb) that made landfall in Tampico, Mexico with minimal impacts. The last one to form of significance was Cat 3 Hurricane Edouard (115mph -955mb) which punched through the Saharan Air Layer and intensified as it headed north and recurved back to the east. Overall, the SAL has been very thick and persistent this year up until now, where we are seeing a shift in patterns with cooler weather features starting to show some changes.
(An example of a dust plume pushing off the west coast of Africa)

Here I’ve edited a surface wind map from Earth Nullschool from September 4, 2014… that shows the winds cutting across the dividing line between vegetative moist air to the south and dry dusty desert air to the north. http://earth.nullschool.net/
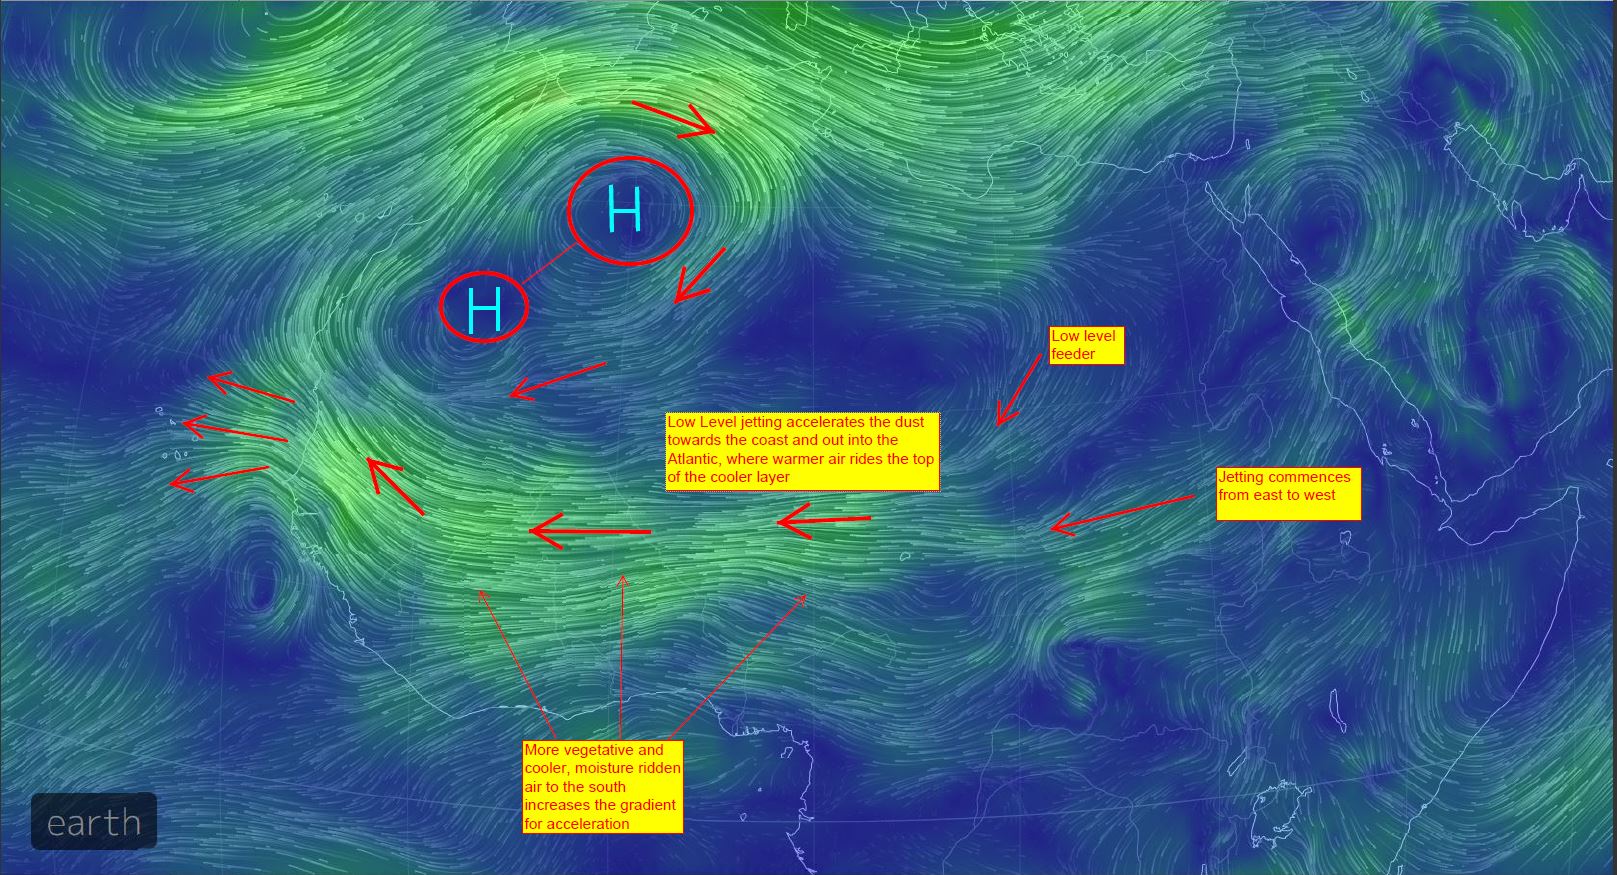
Here is the driving mechanism over the ocean to keep the flow going from east to west…

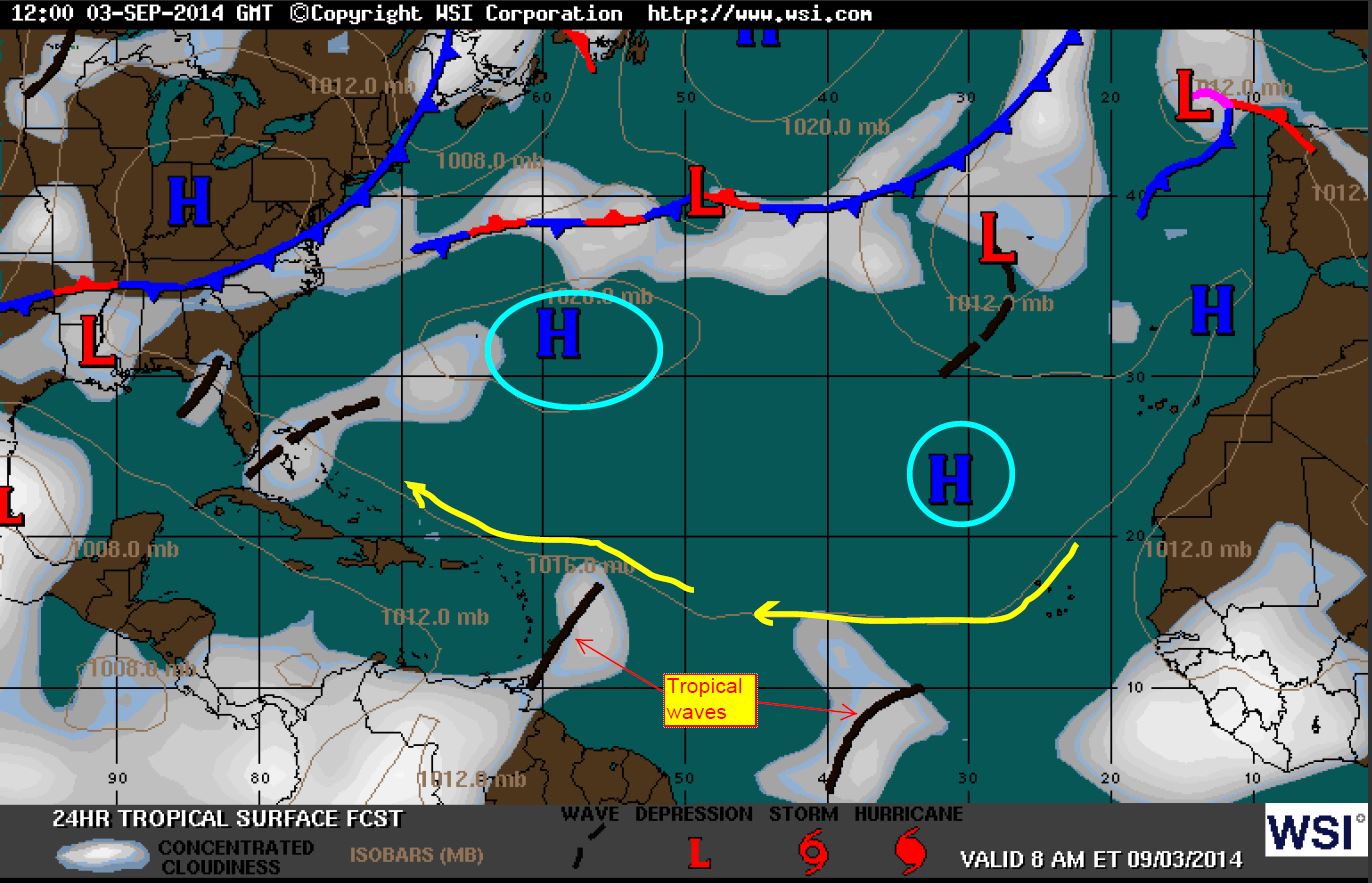
The end of August through the month of September showed plume after plume of these dust layers streaming out into the ocean to tear apart the tropical waves. The following GIF’s and surface maps show the continuous pattern of dust layering along the Easterly trades.

9/12/14 – 9/17/14
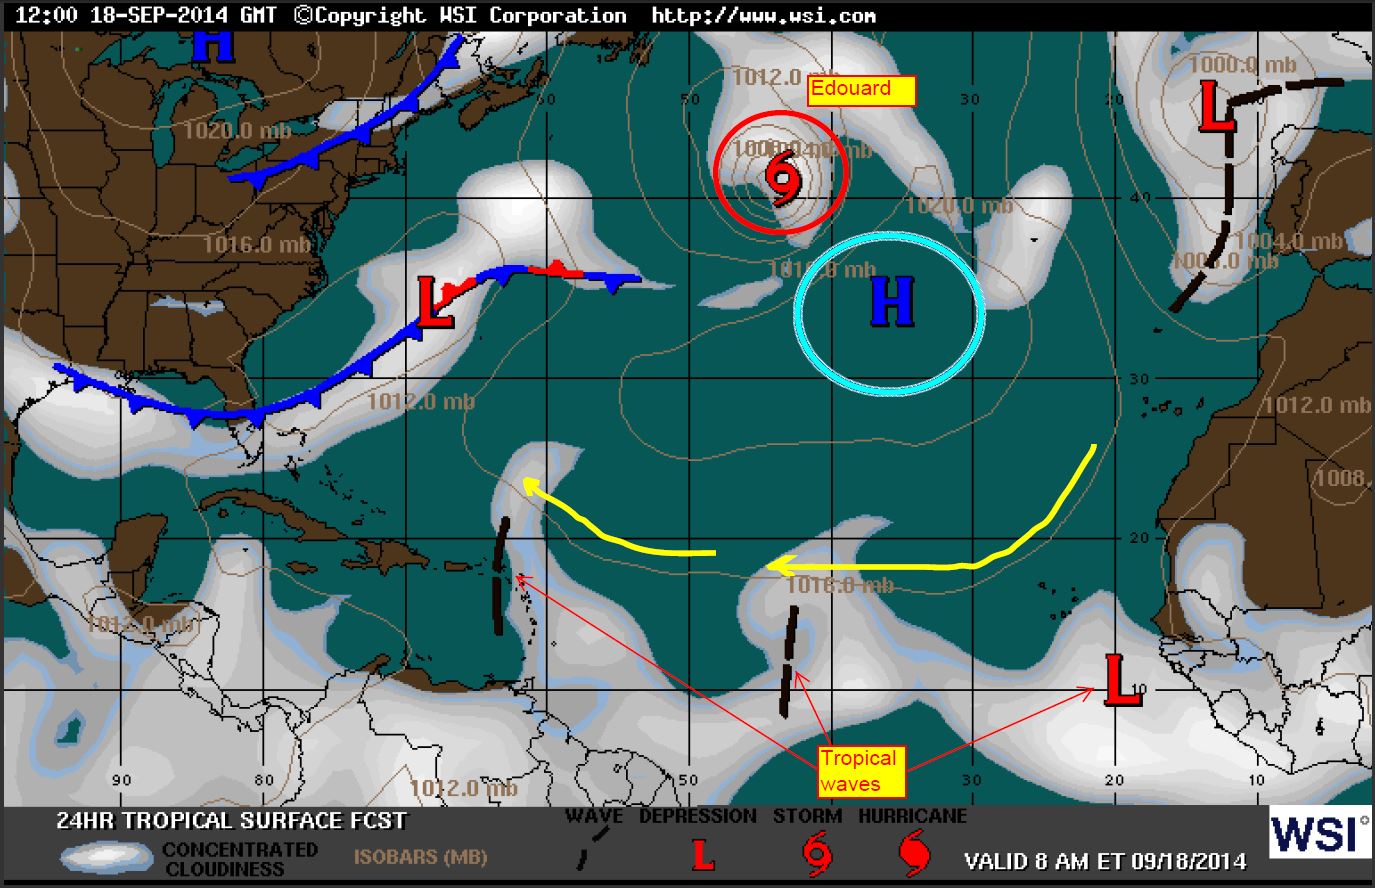
9/18/14
9/18/14 – 9/23/14
9/25/14 – 9/30/14
Here is an idea of what the precipitable water shows from 9/30/14 – 10/3/14…the shades of blue represent the drier air and you can see how it bulges through in accordance with the dust pocket.

And now we see the SAL start to fizzle out as seasonal pattern are shifting. Perhaps any systems coming off the coast from here on out might have a better chance than during the peak times for activity. With the fall pattern along the eastern USA, we are less likely to have a landfall and most systems look to recurve as they wander west.

10/5/14 – 10/7/14 – the dust being stopped and actually shifting back to the east by upper level jetting.

Here are the surface winds from October 7, 2014. Notice the retrograding or opposing wind shifts (small areas of low pressure) that are starting to keep the dust at bay.

Here is the 500mb view (~18,000 feet up):
And the 250mb with a very strong opposing upper jet from west to east (~35,000 feet):
There is quite a bit of upper level shearing occurring along the northern ITCZ, so we are again less likely to see any current tropical development as systems would encounter yet another road block. And with Sea Surface Temps consistently falling as we enter our cooler seasons, we could be wrapping things up soon from the Cape Verde side of the world. Granted we could still see a late seasonal peak – and possible cold core hybrid systems such as extra-tropical storms or even the warmer core sub-tropical storms develop from residual waves or new waves coming from the east. Overall, the SAL has prevailed this year as the protector of North America from African bred storms for most of the summer.

Shea Gibson
WeatherFlow Meteorologist/Wind Forecaster
SE Region/East Coast
New Stations Projects/Outreach
Twitter: @WeatherFlowCHAS
Facebook: https://www.facebook.com/WeatherFlowCHAS/
Sources: UW-CIMMS for SAL and UW-CIMMS for PWAT, Earth.nullschool.net, NASA images, NOAA SST’s, WSI surface maps (now the Weather Company)