by WeatherFlow meteorologist Shea Gibson 6/25/14
See part II of this series here: https://blog.weatherflow.com/sal-ty-atlantic-the-saharan-air-layer-part-ii/
See part III of this series here: https://blog.weatherflow.com/sal-ty-atlantic-part-iii/
The “Dusty Tongue” of the Sahara keeps the northern ITCZ and Eastern Caribbean dried out through June 2014.
The Saharan Air Layer, or SAL, is fed by Easterly mid-level jetting over the deserts of Africa pulling sand particles into the atmosphere – especially during haboob activities. As this air mass heads westward and meets the Atlantic along the northwest African coast, it is undercut by cool, moist low-level air – or the “marine layer”. This dusty air is very dry and warm and is lifted above the marine layer, resulting in an atmospheric inversion with warm dry air aloft and cooler air below. The boundary between these two prevents convection from occurring and can assist in cooling sea surface temperatures. Both of these work in tandem to suppress tropical developments. Along the northern Intertropical Convergence Zone, the Easterly trades continue to carry this dust across the Atlantic at the lower and mid levels, where eventually some of it lands over North America. In this blog, the concentration has built up over the eastern Caribbean to disintegrate any tropical waves or convections to that region. It’s a rather impressive “pooling” of dust so far east of Africa.
This is a great HD resolution shot of African dust making its way out over the Atlantic…
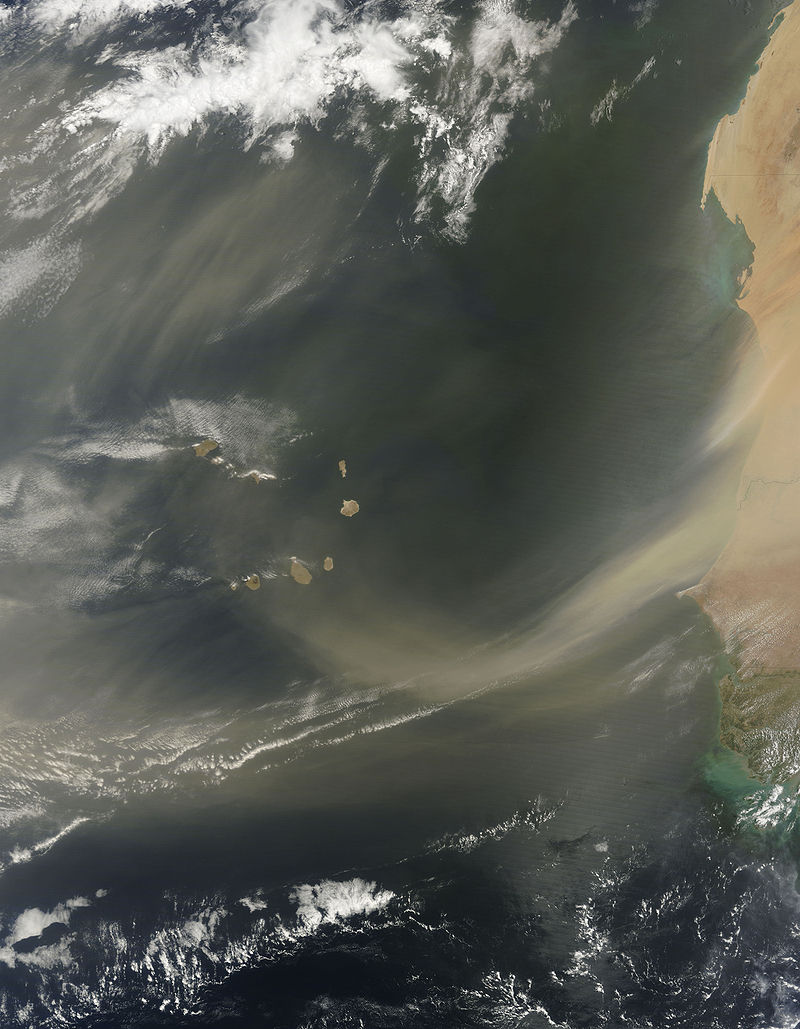
This massive sand storm push into the Atlantic photo provided by Norman Kuring of the SeaWiFS Project with NASA in February 26, 2000.

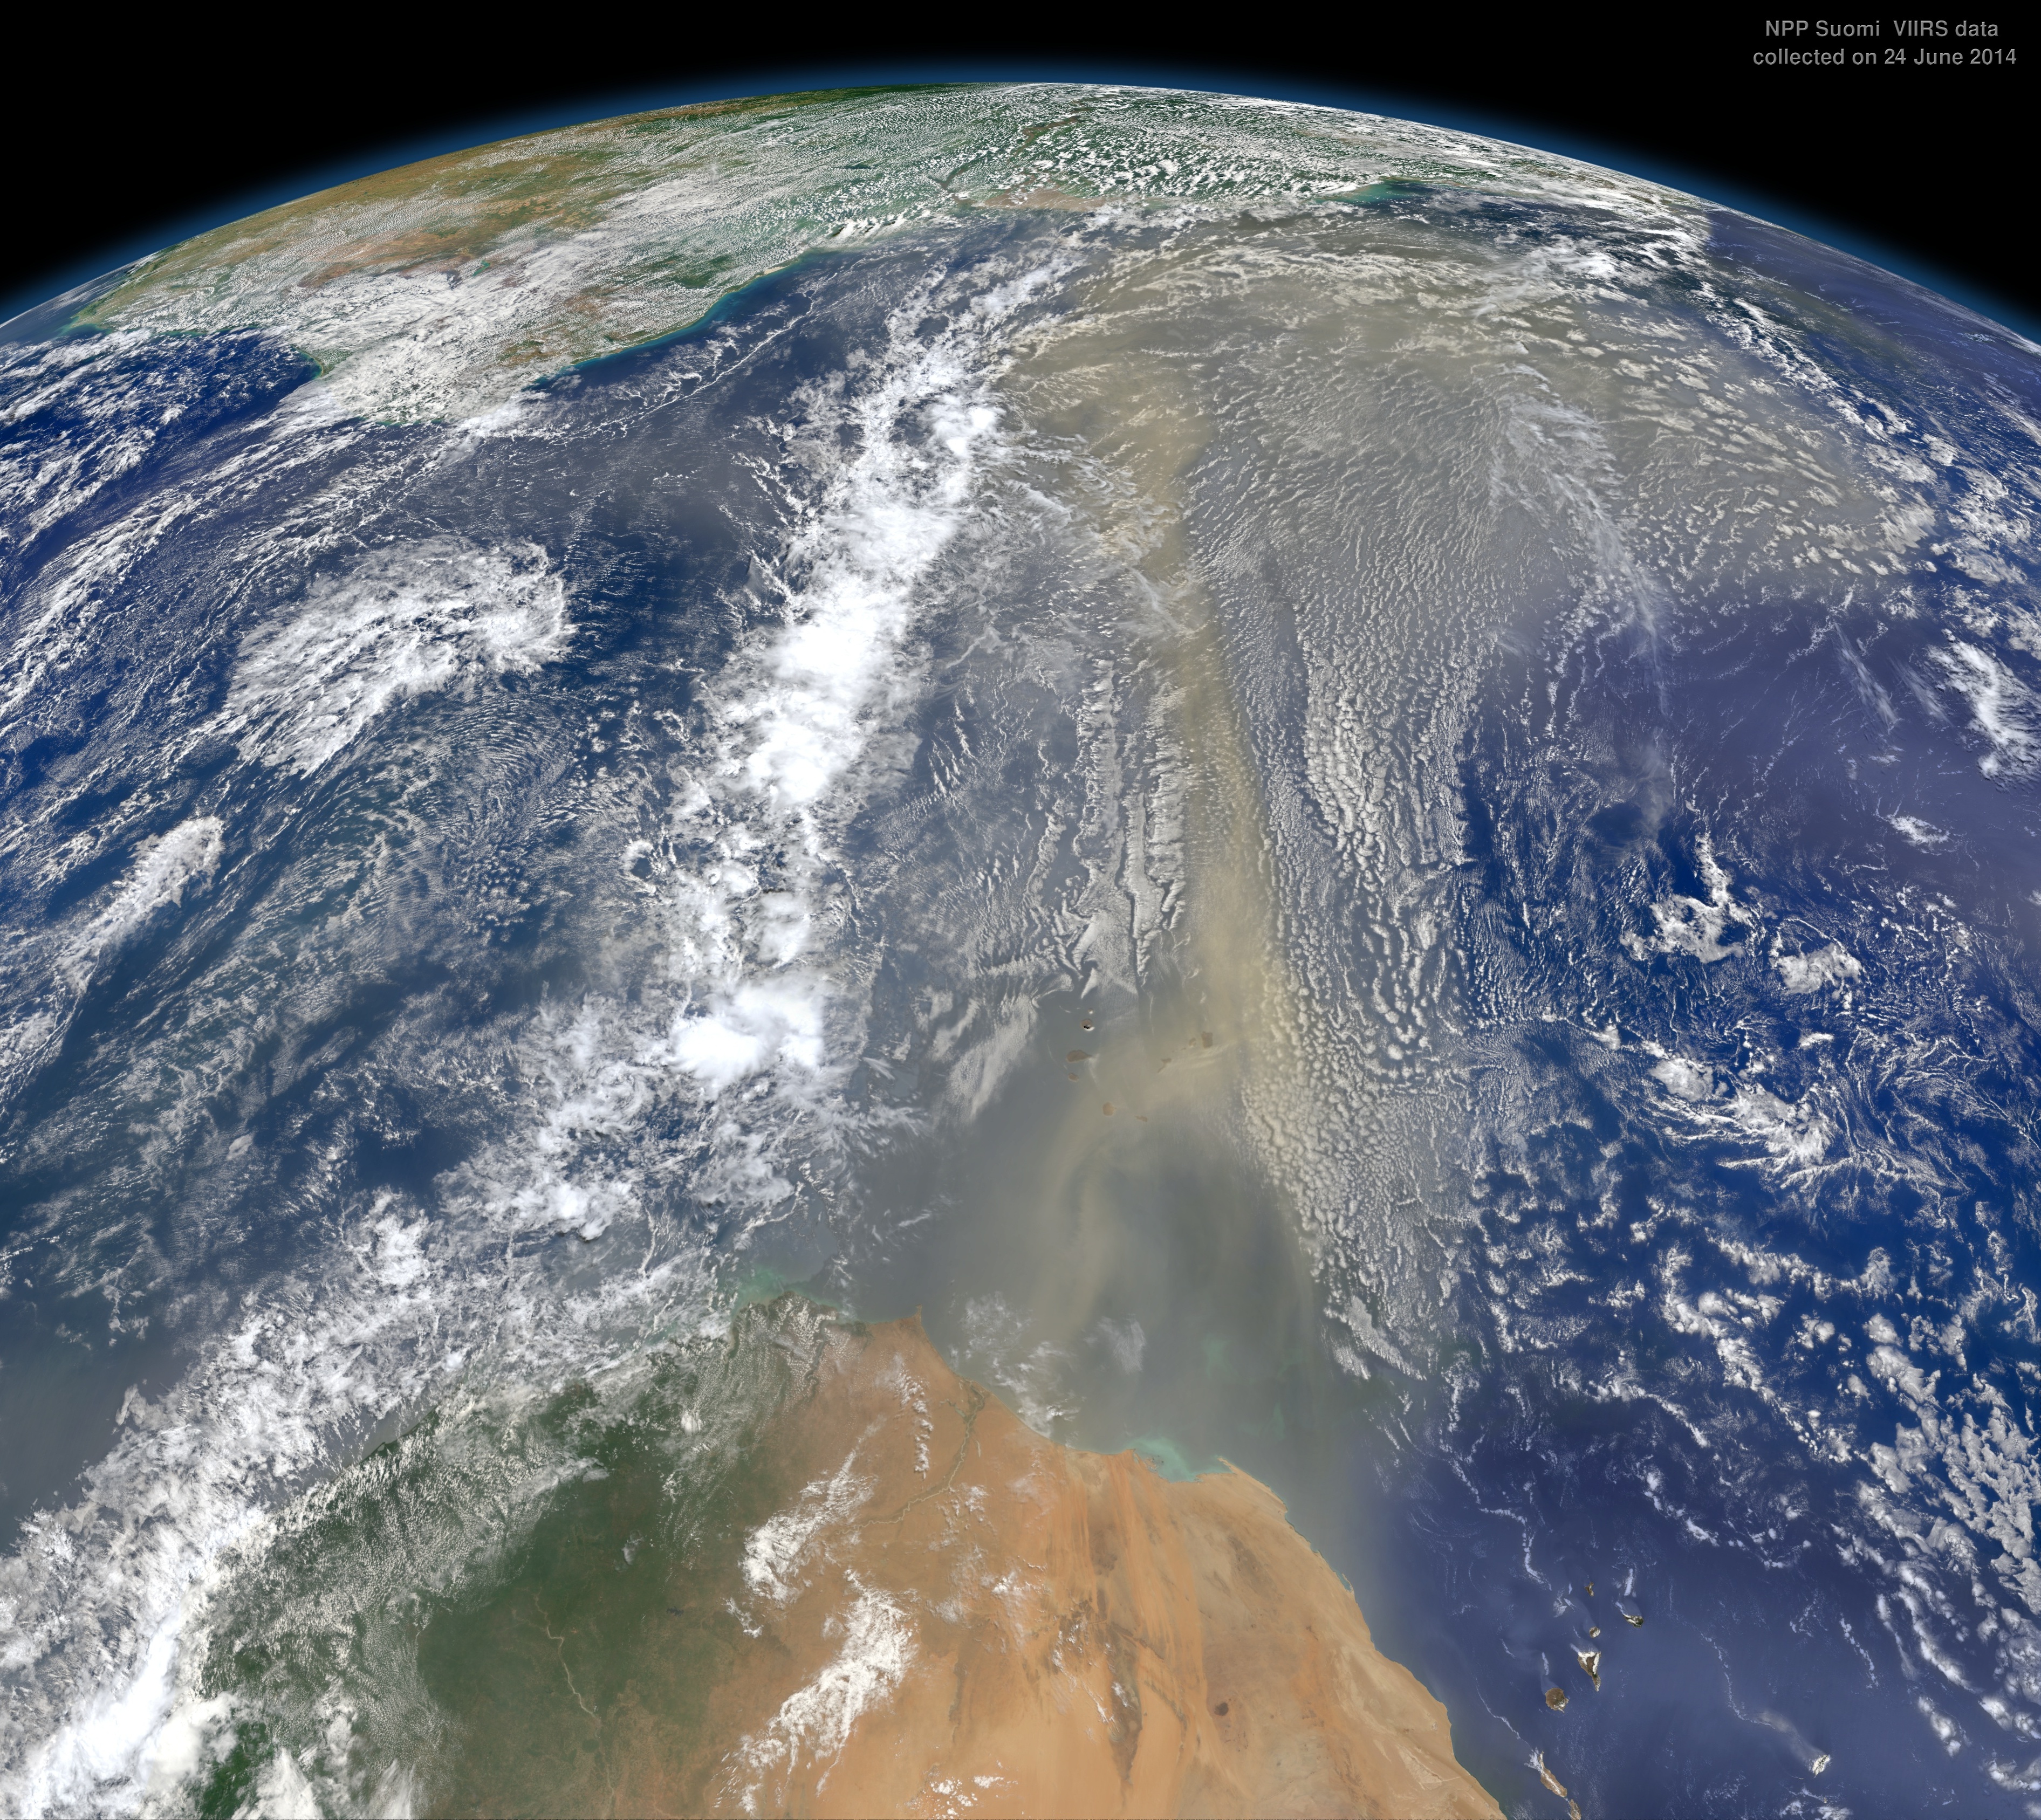
And this one just recently on June 24, 2014. The image is south to north as seen via NPP Suomi VIIRS satellite.
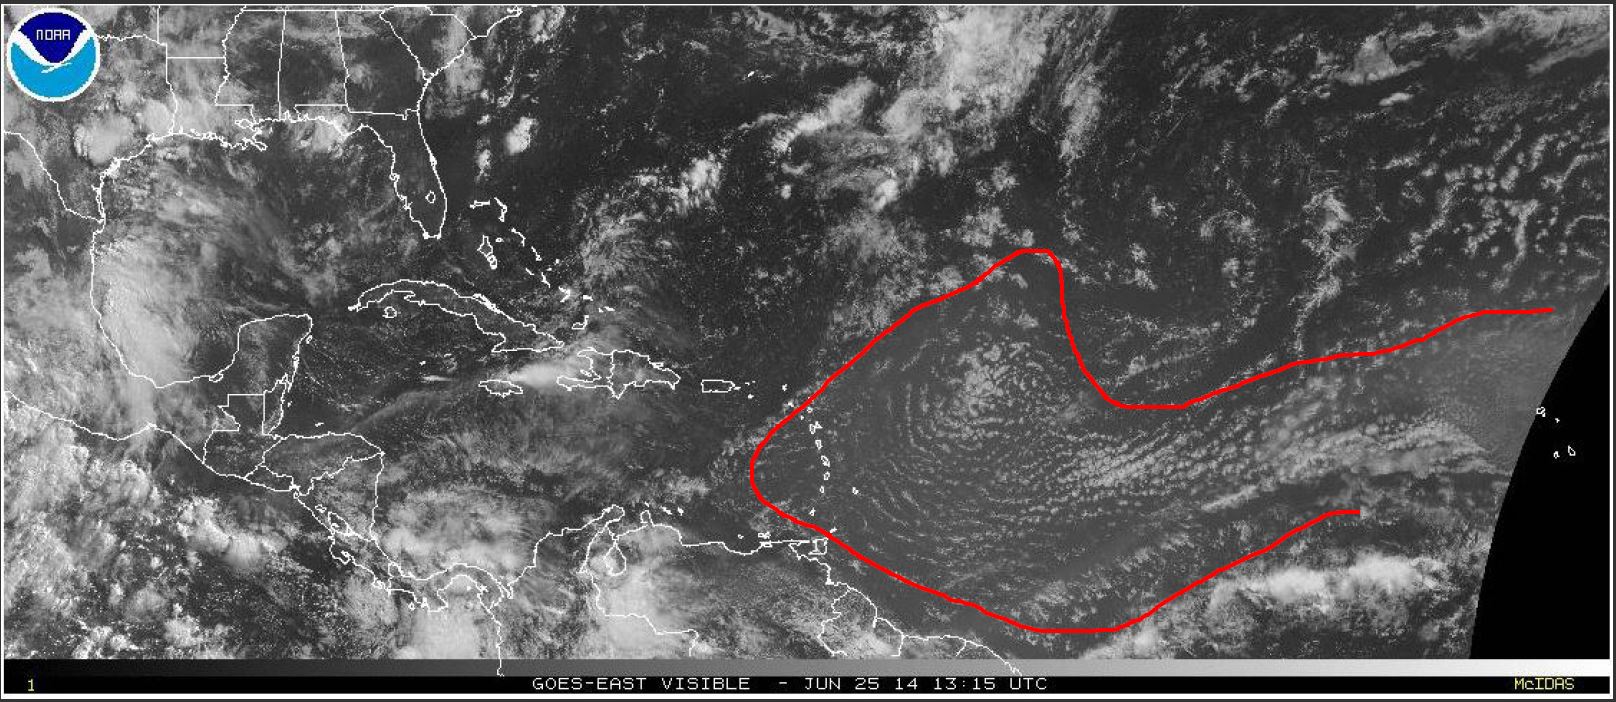
Check out the recent amount of dust being streamed out across the Atlantic and pooling over the eastern Caribbean, with the surface Easterly trades working in tandem with low to mid level currents. This has been the norm for almost the entire month of June.

Here’s the visible….
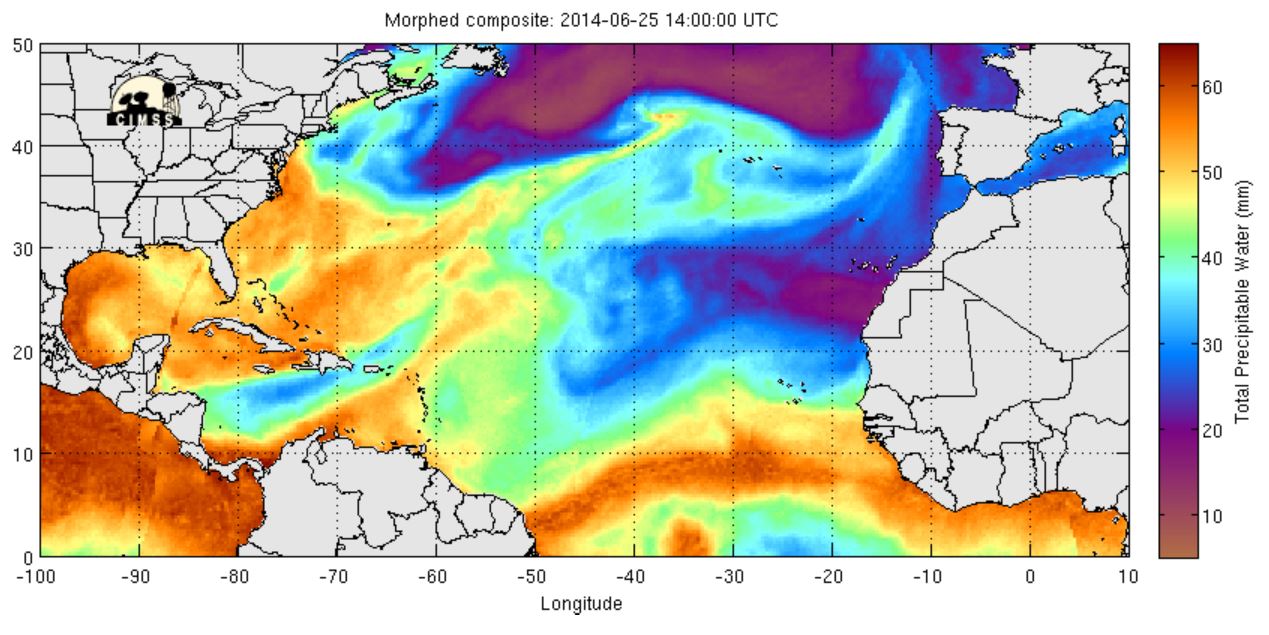
Precipitable Water:
Current winds at the surface show typical Easterly Trades along the Leeward Islands, where greatest concentration is just overhead.

And here is the wind profile at 700mb (~9900 feet)
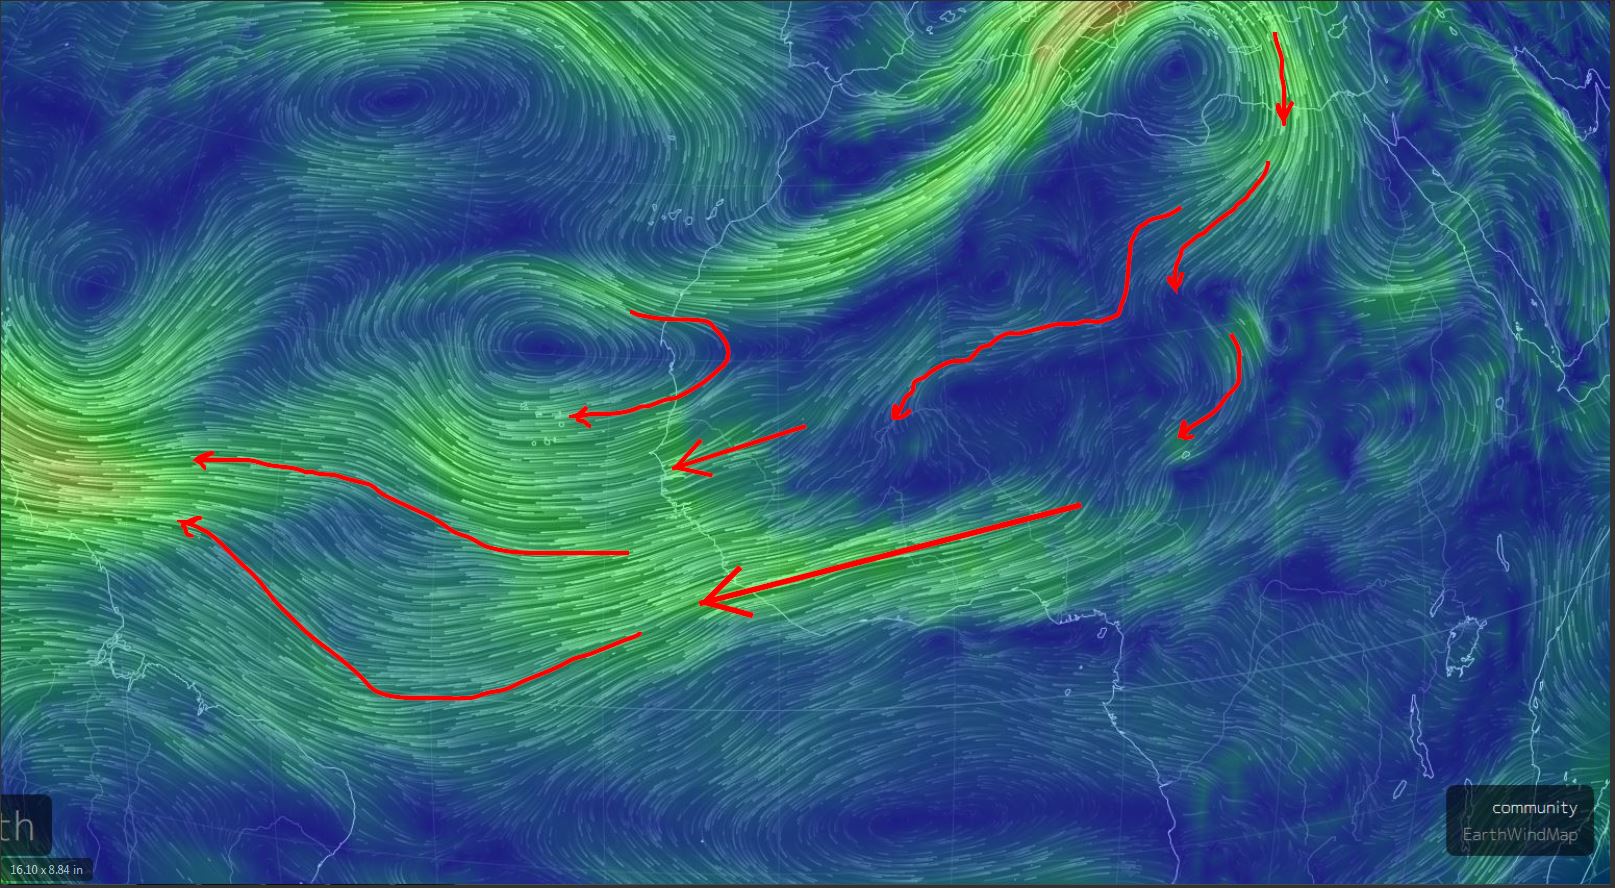
500mb (18,00ft)

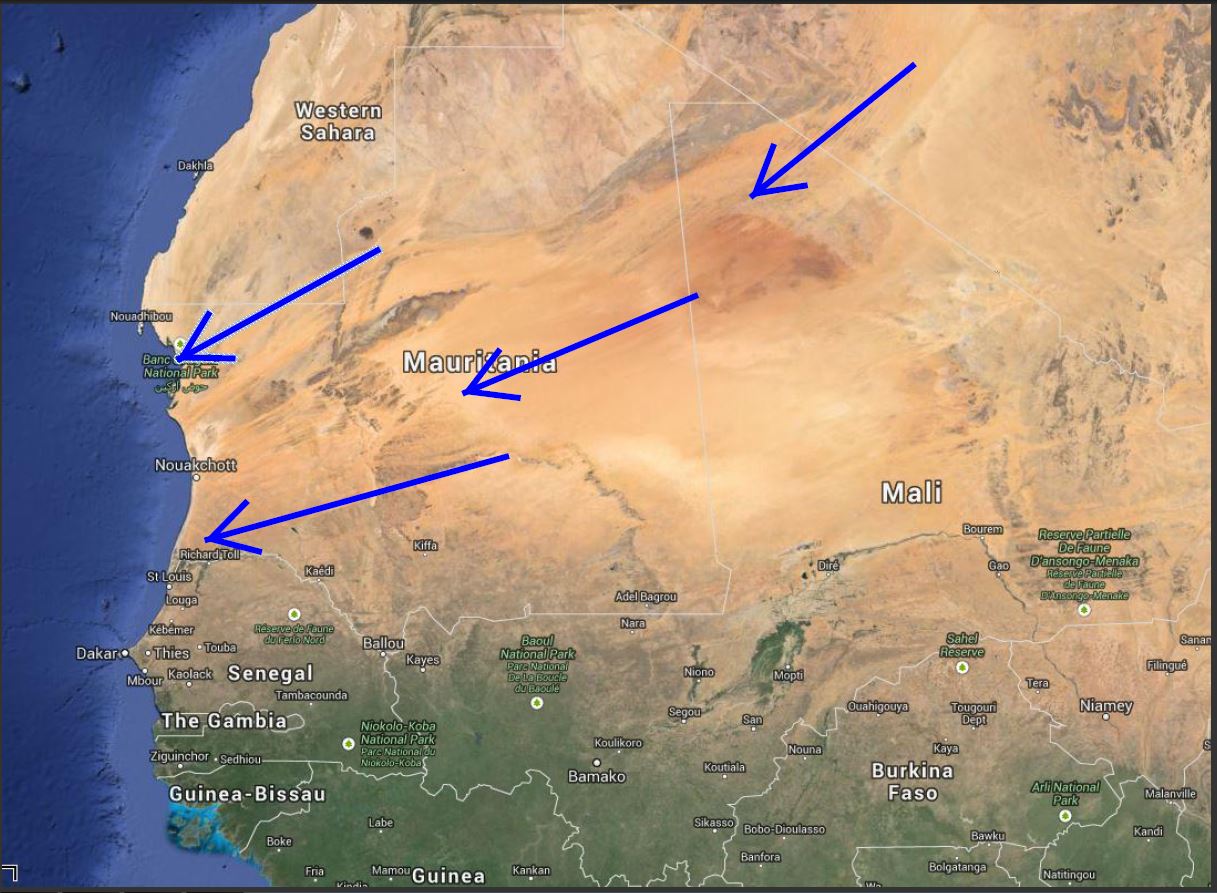
Check out the landscape of the desert surface where you can clearly see the path of winds with erosional and transportational processes.

And here where the dust/sand river feeds out over the Atlantic.
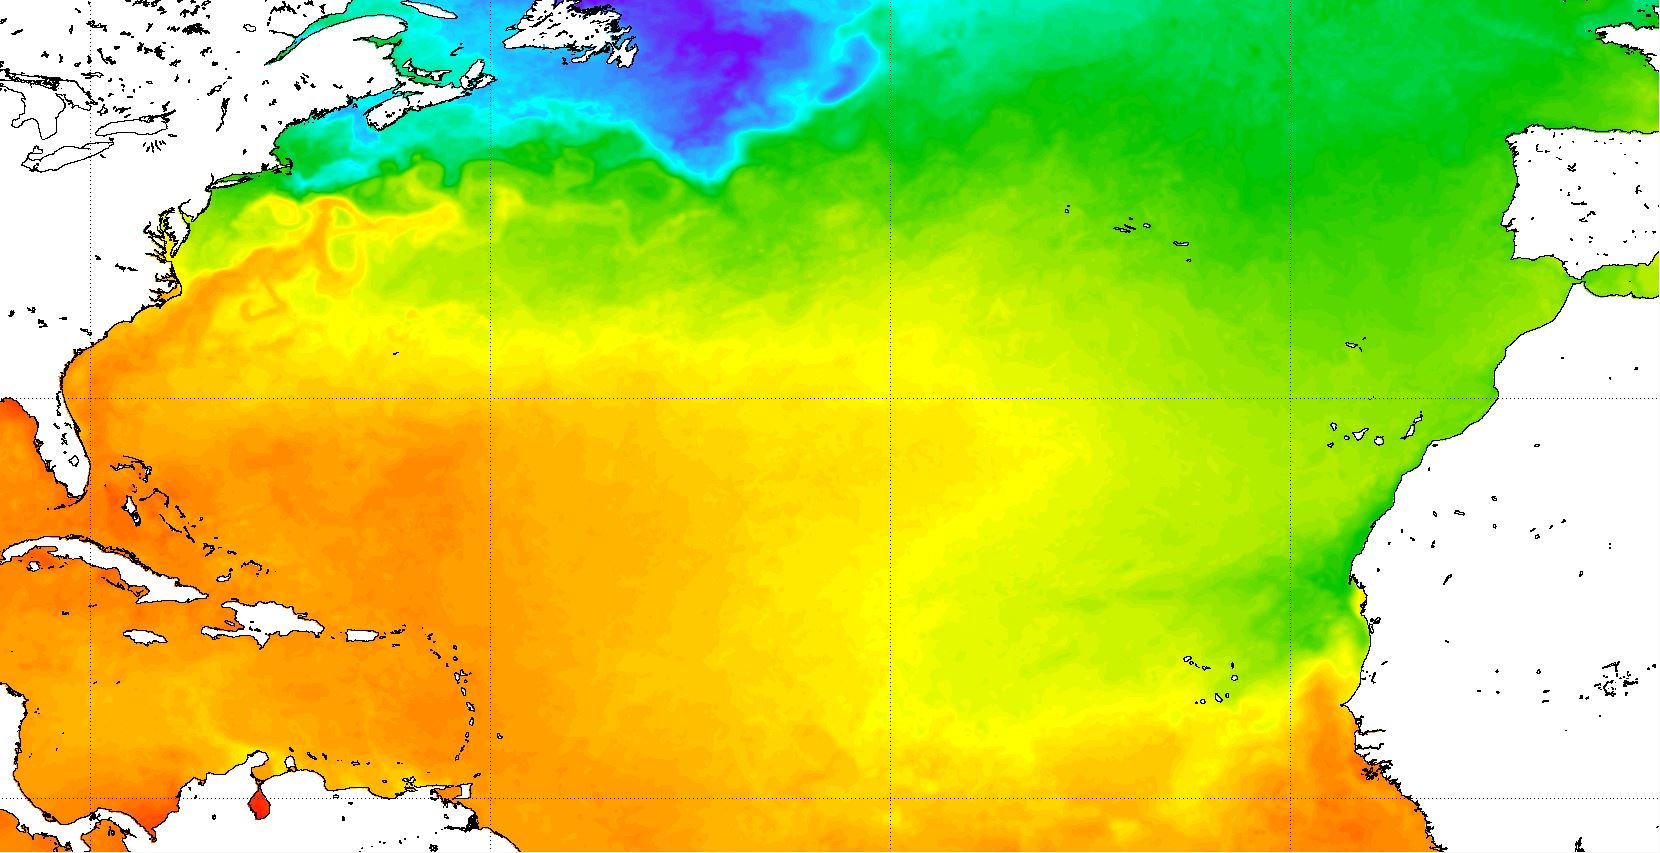
One other point is the current SST’s being below normal around 77°- 79° along the dry areas until we get into the Caribbean where 80°+ SST temps start to show.

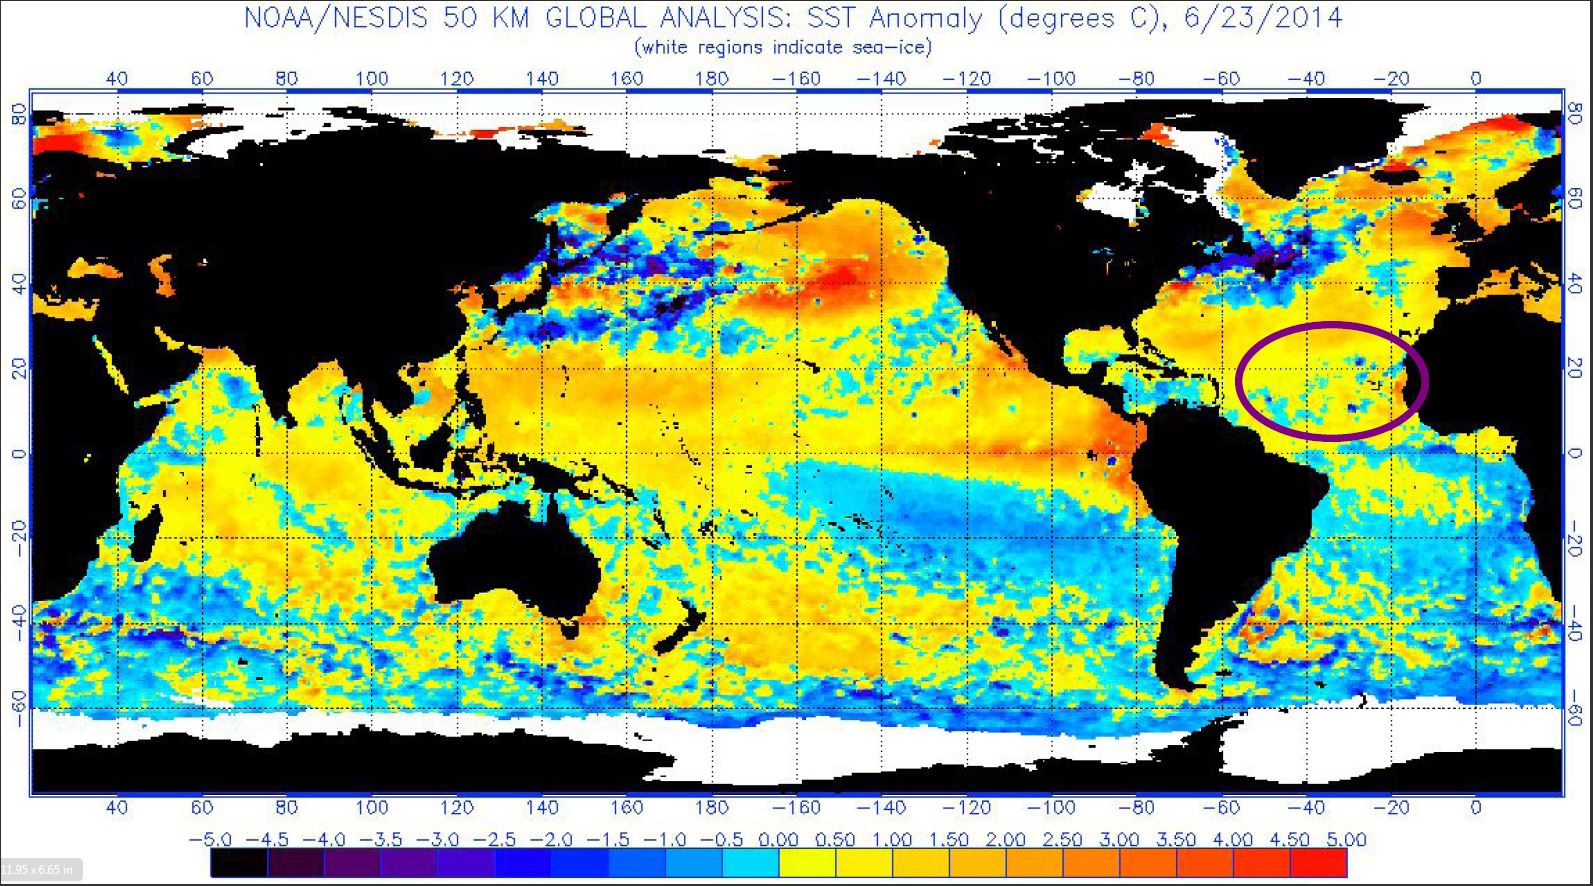
SST Anomaly showing lower-than-normal temps west of Africa.
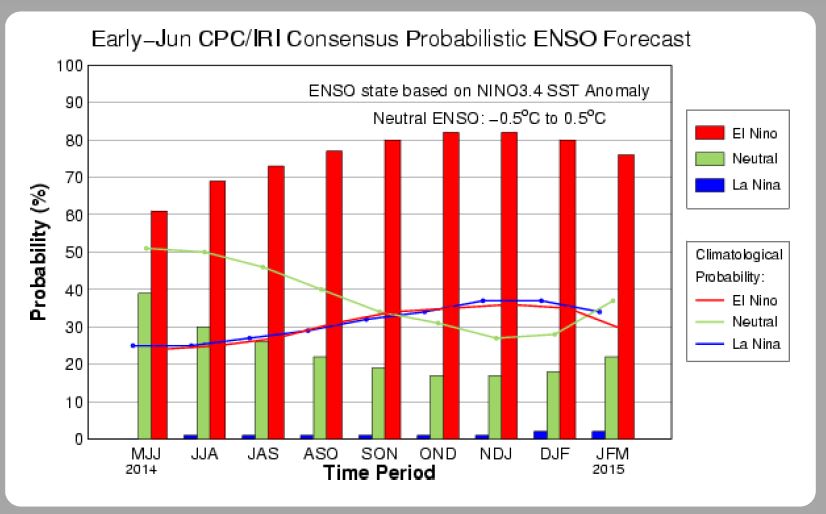
And of course a mention of latest El Niño stats (calmer Atlantic season? We shall see.) Next ENSO update July 10.
Shea Gibson
WeatherFlow Meteorologist/Wind Forecaster
SE Region/East Coast
New Stations Projects/Outreach
Twitter: @WeatherFlowCHAS
Facebook: https://www.facebook.com/WeatherFlowCHAS/
Sources: NASA Sea WiFS, NPP Suomi VIIRS , NOAA GOES-EAST, NOAA SST’s, Earth/nullschool.net, NCEP ENSO Diagnostic discussion page, UW-CIMMS PWATs , UW-CIMMS SAL, Tropical Tidbits