By WeatherFlow meteorologist Shea Gibson
Well it’s that time of the year for “marine layering” again as water temps have cooled to the upper 60’s to near 70°. I’ve been recording when marine layering starts for the last 2 years in order to further document the initiating time periods. In the 2013, it started on Friday, November 1st. Last year in 2014, it started much earlier on Friday, October 3.
See the previous blogs:
2013: https://blog.weatherflow.com/1st-marine-layering-event-affects-se-region/
2014: https://blog.weatherflow.com/marine-layering-effects-start-in-the-se-region/
This year we have seen a more progressive marine layering process as water temps have fallen slowly after the October Rain Storm of 2015. Instead of a substantial drop all at once like we have seen the last 2 years, we have seen 3-5 degree drops in two separate occasions with cold air intrusion and more NE/ENE events. From October 1 – October 12, we went from ~79-80° down to ~72/73° and held there until October 15.
From there we can see the trend from October 16 to present day 11/5/2015 in the NASA Sport SST animation, where temps fall to 68/69° and hold.
The thing to remember here is that warm air masses tend to cause decoupling over the cooler, more stable waters. This means that a layer of cooler air hangs over the cooler surface unless warm air is able to penetrate and mix into it for instability (hence…wind). However, some of these air masses ahead of recent cold fronts haven’t been significantly warm and some have, so we’ve seen a mixed variety of surface mixing and decoupling. Higher humidity levels are said to be a large part of the reason for decoupling; however, even with dry air over the coastal region, these layers create their own higher humidity levels at the surface. They are in many cases, their own body of cool air surface pooling.
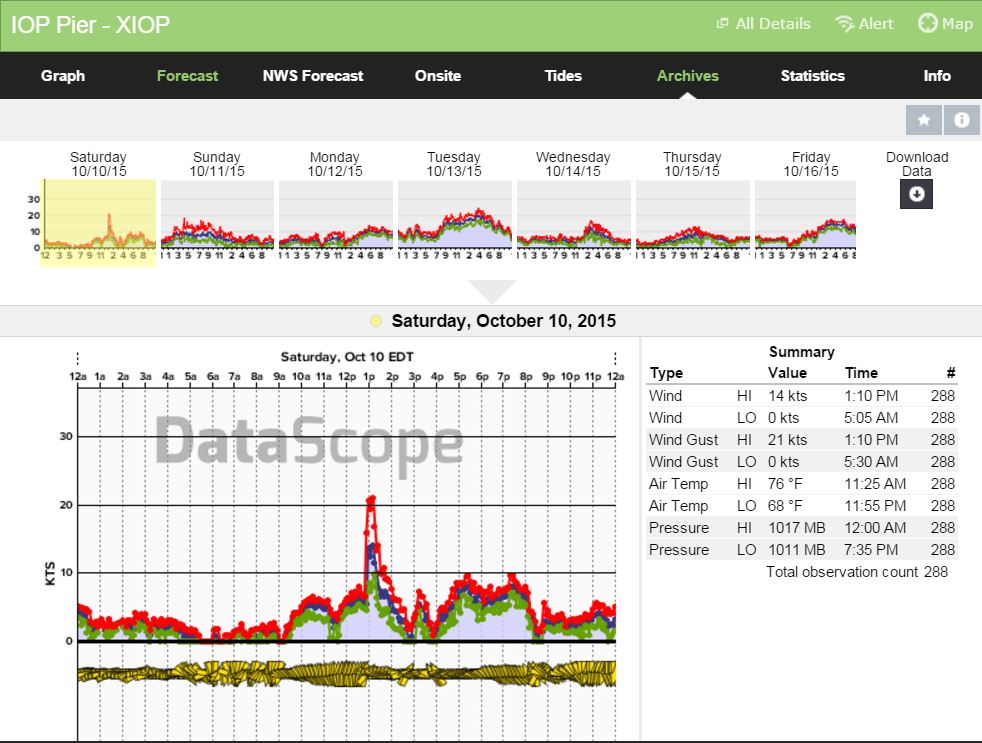
The actual first signs of marine layering along a SE flow occurred on Saturday, October 10 ahead of a cold front.
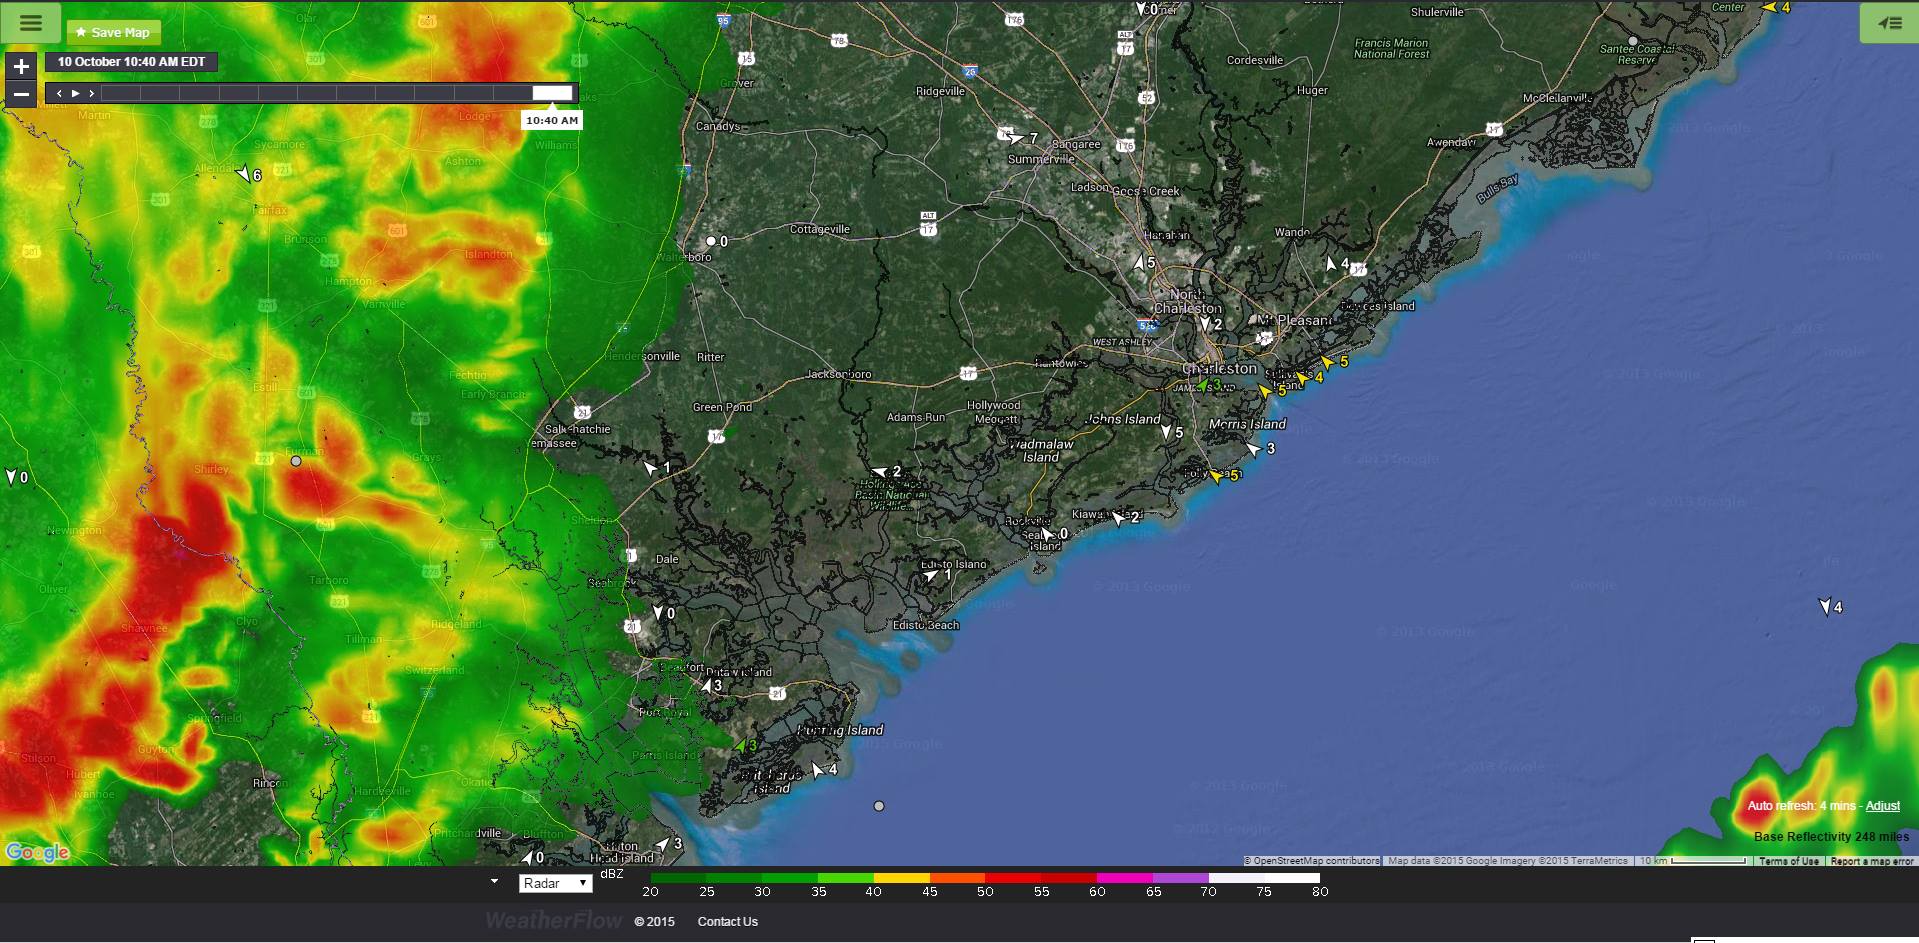
Here are a couple of pictures where you can see thin hazing and fogging at a distance. Pics from local H. Mikell Evatt of Charleston, SC.
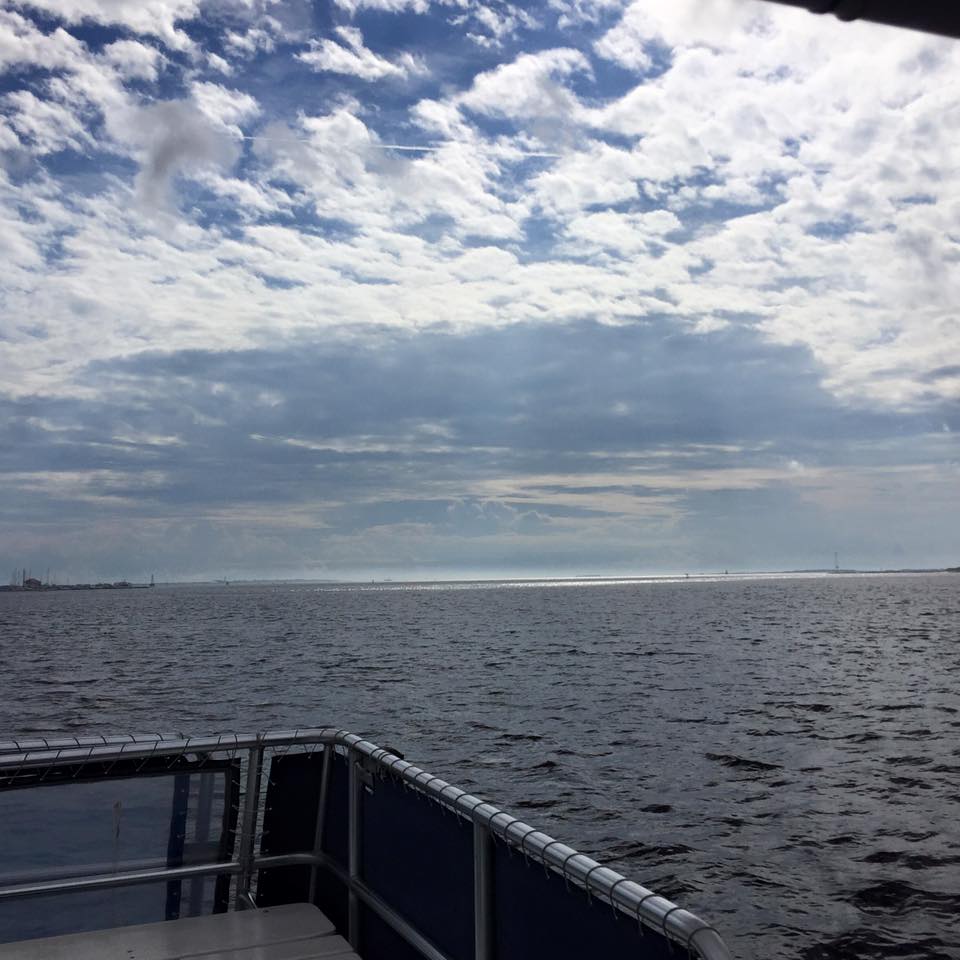
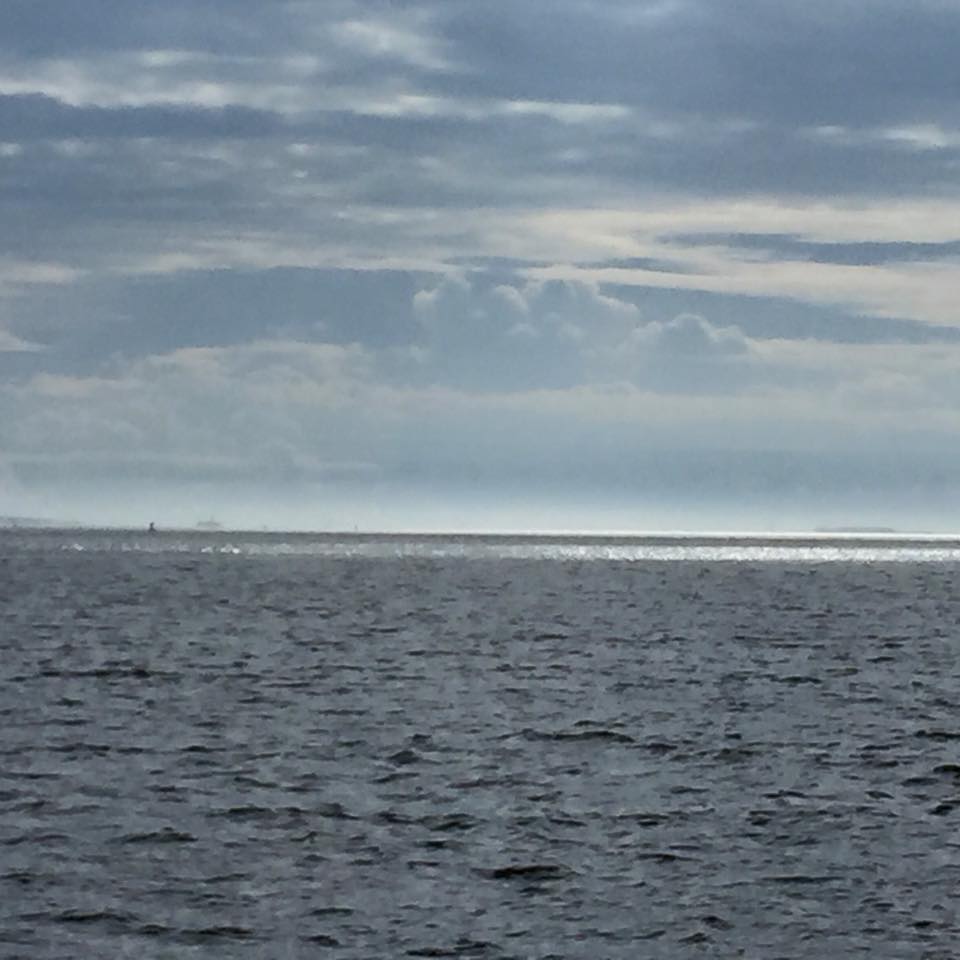
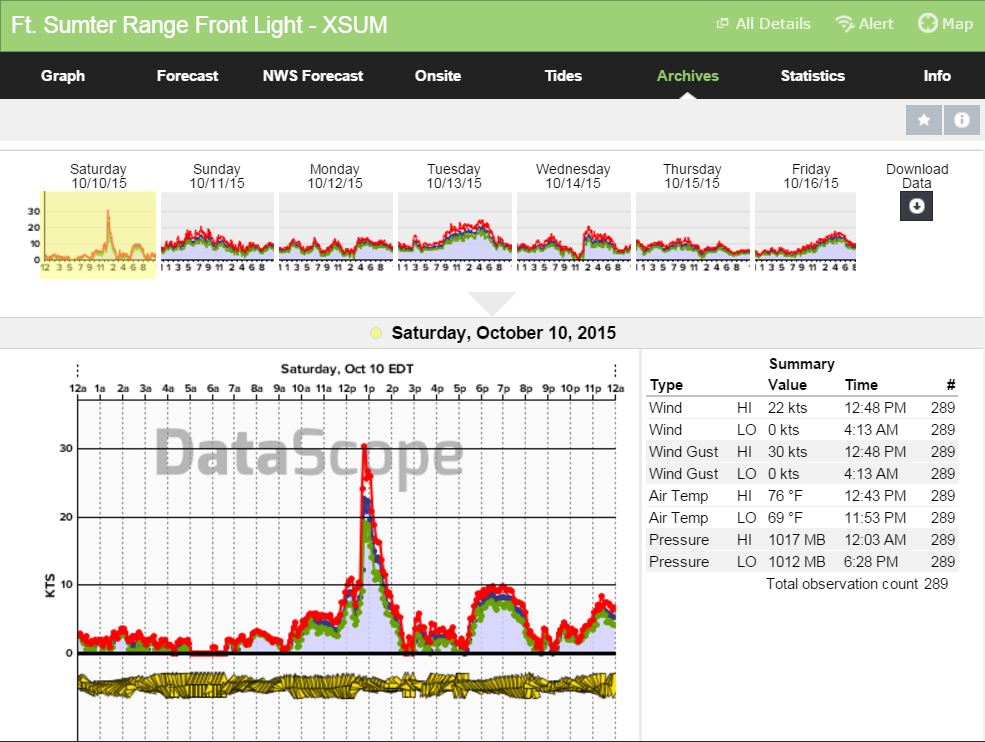
The stable layer lasted for awhile before the unstable air and storming moved in to clear it out. Winds never got above 10kts until storms kicked (you can see the arrival in the higher “spikes”). Notice in the next 2 pictures the air temperature over the area was around 76 degrees- only about 4-5 degrees higher than the water temp.
Charleston Harbor 10/10/15:
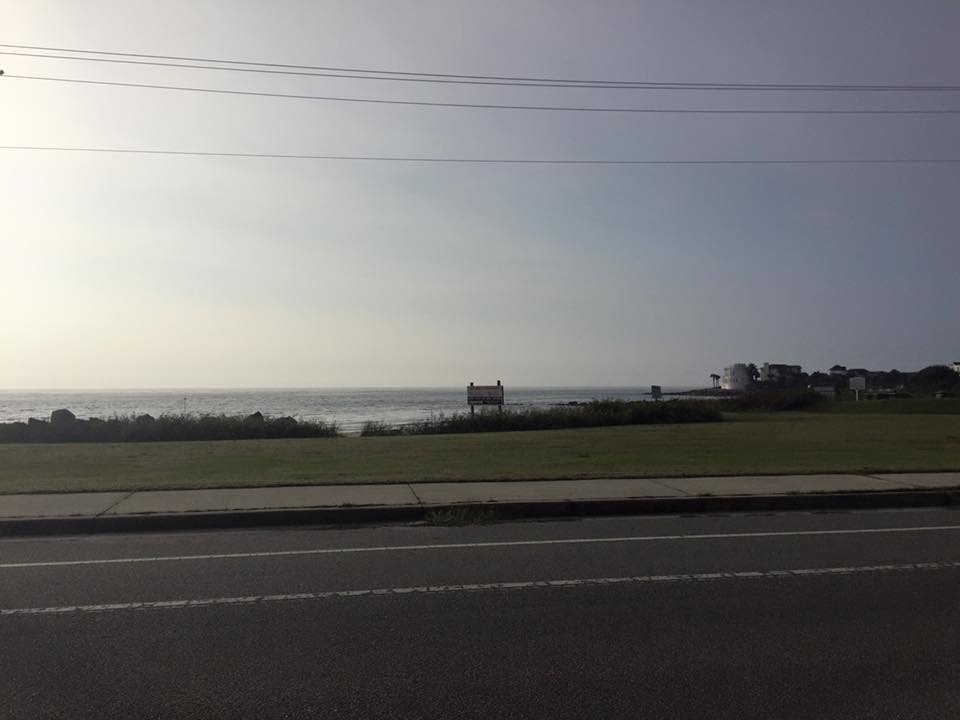
Isle of Palms 10/10/15:
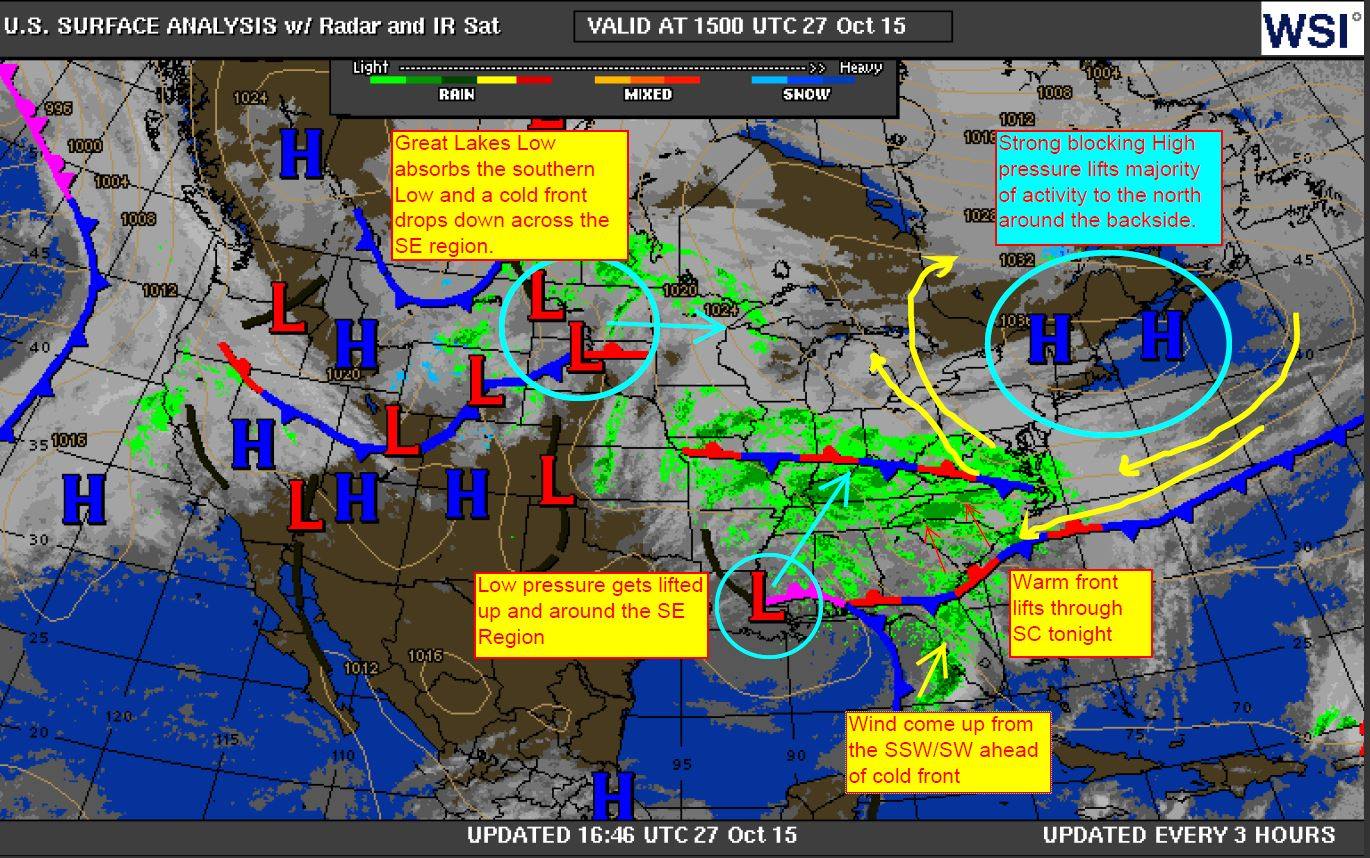
We had one another cold front approach on October 28th as Low pressure from the Gulf lifted to the north. This brought a warm air mass up along and behind a parting warm front. Here is the edited WSI surface map from the day before showing the projected scenario.
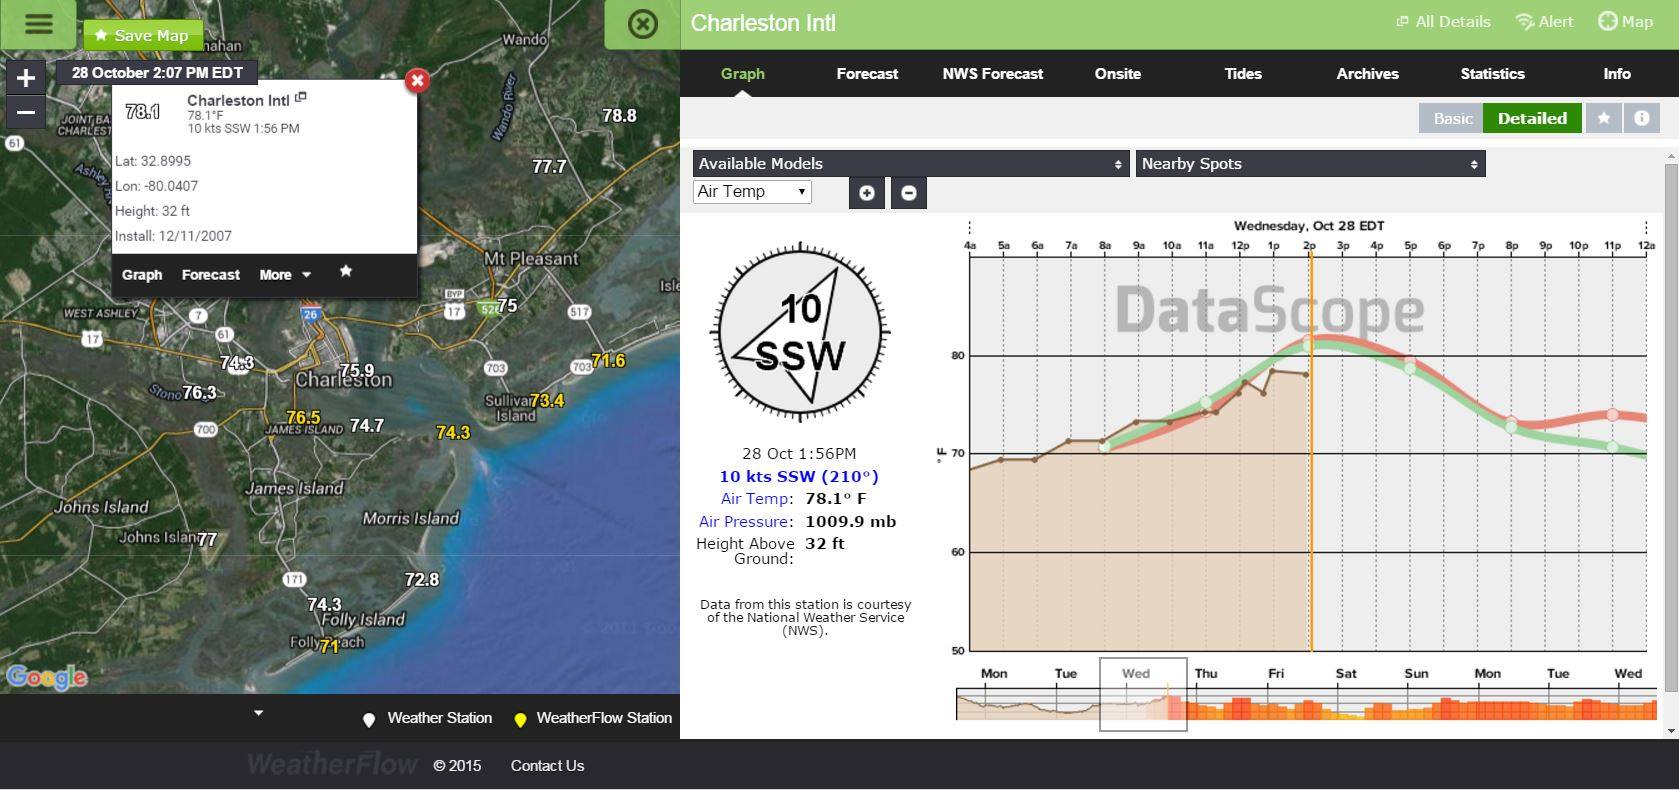
This resulted in warmer air temps trying to inundate the coast; however, the cooler waters kept air temps cooler near the beach as a thin marine layer developed. Notice temps nearing 80° inland..and remaining closer to the actual water temp of 69° along the beaches with the SSW onshore flow.
Here is the result…moderate to strong winds develop in the harbor downwind of the land mass where this warmer and drier air allows for mixing at the surface. The overall environmental instability created allows for winds to build over the harbor- especially as low level jetting is involved ahead of frontal activity. But this wind is turbulent and rather unstable itself…showing lots of UP’s and DOWN’s. Notice the beaches are 7-10kts lower in speeds due to the marine boundary layer created from having no warmer drier air mass coming from land. It’s all coming from the ocean.
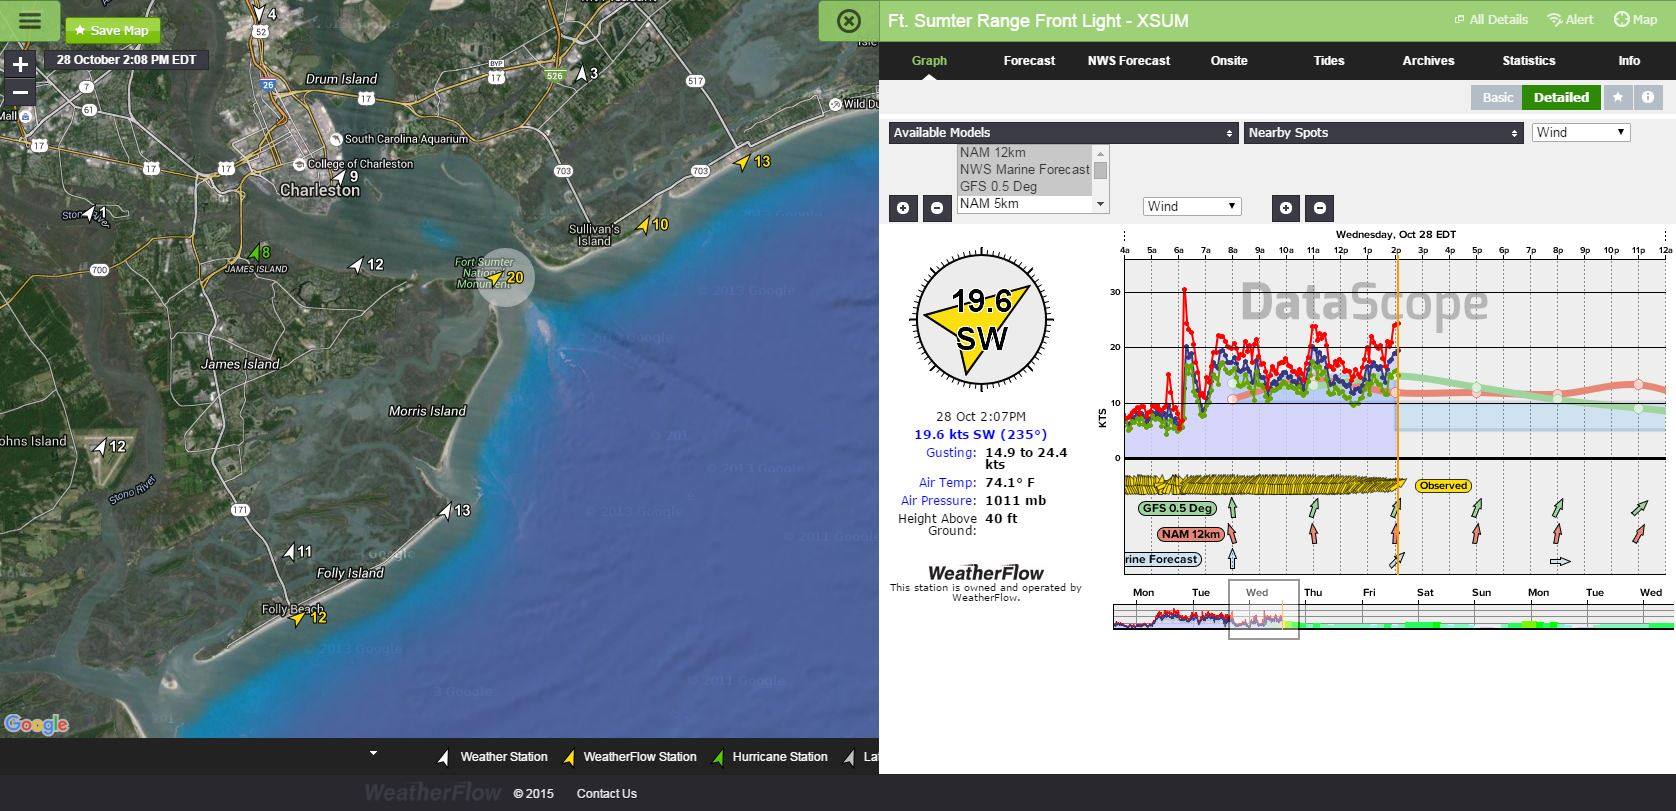
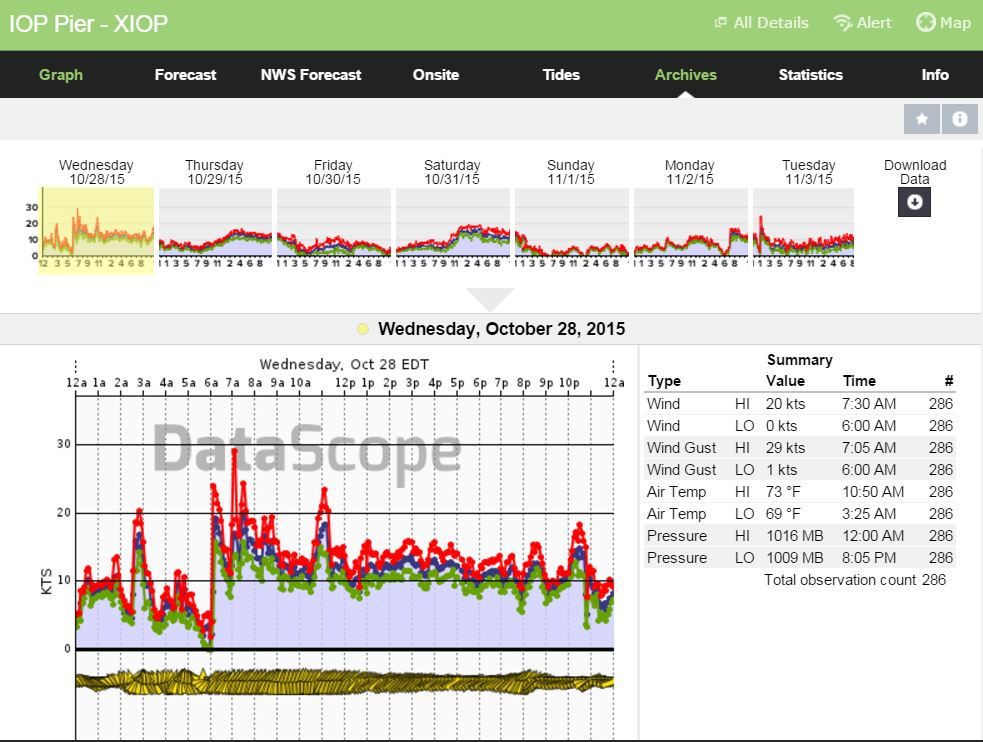
Graph of the harbor for the day:

Here is a graph of the IOP sensor for the day, which shows UP’s and DOWN’s as winds came up during temperature equalization around 11:00AM, but then struggled and eventually fell as air temps rose inland. Even with the afternoon Sea Breeze coupling and Coriolis effect veering winds SSW–>SW, we still showed marine layering cap speeds at the beaches to low teens.
This continued into the next day ahead of the slow moving front. On October 29, 2015 – local kiteboarder and Air Force pilot Sam Johnson made a physical observation at the beach Station 28.5 of Sullivan’s Island and stated, “The hazing wasn’t really noticeable right at 28.5, but looking towards the Isle of Palms pier (north) or towards the harbor (south), it was definitely present.”
Further evidence after October 28th around November 2nd has shown continued marine layering, so I believe it is here to stay – or at least to be weary of its effects for forecasting in the immediate future and through the winter until the Cannonball Jellyfish return. Yep, believe it or not, jellyfish. https://blog.weatherflow.com/gulf-stream-surge-brings-the-cannonballs-back-early-in-2015/
This picture was provided by H. Mikell Evatt on November 2, 2015 at Breach Inlet, which is a coastal break between Isle of Palms and Sullivan’s Island. It shows light fog that has developed along the beaches.
And here is what was going on in the harbor vs. beaches at that time:

So… I’m officially dubbing October 28th as the true day of the start of marine layering for Fall 2015 for the South Carolina coast.
As you can see in the last few pics of the winds, the line seems almost very fine between the higher speeds and the lower speeds…and guess what? It really is almost like drawing a line in the water.
But you’ll have to read more about it here 🙂
https://blog.weatherflow.com/drawing-a-line-in-the-water/
Cheers and stay safe out there on the water!
Shea Gibson
WeatherFlow Meteorologist
SE Region/ East Coast
Twitter: @WeatherFlowCHAS