By WeatherFlow meteorologist Shea Gibson
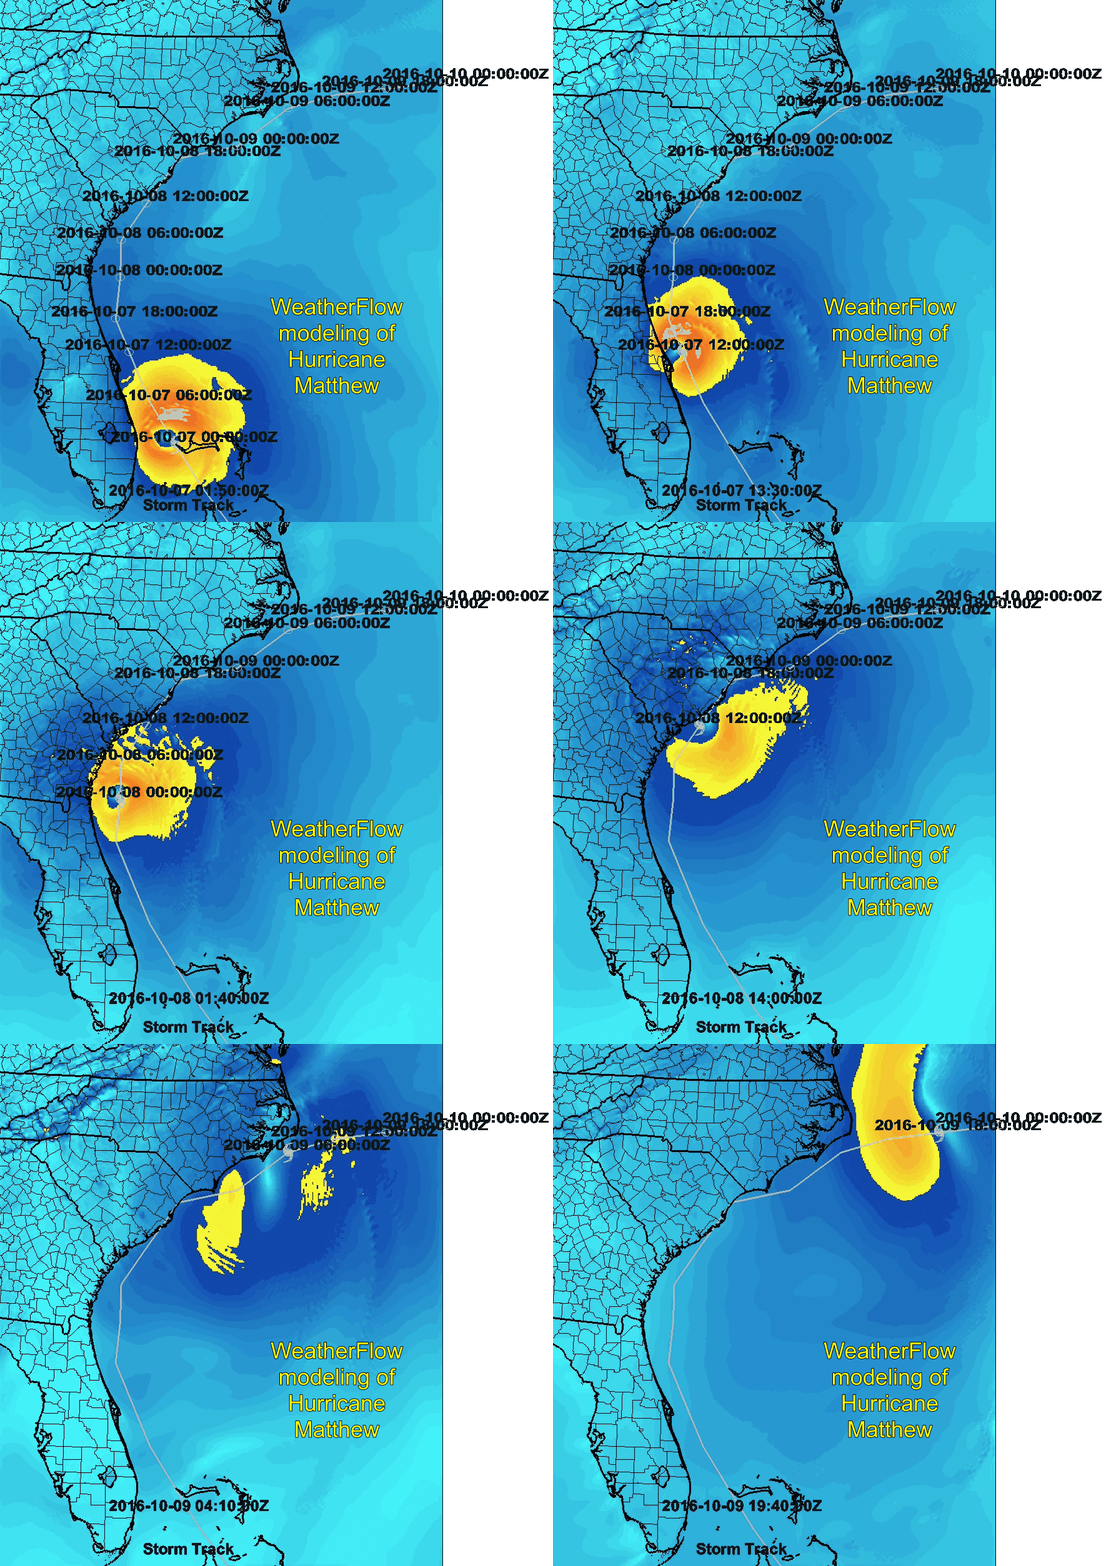
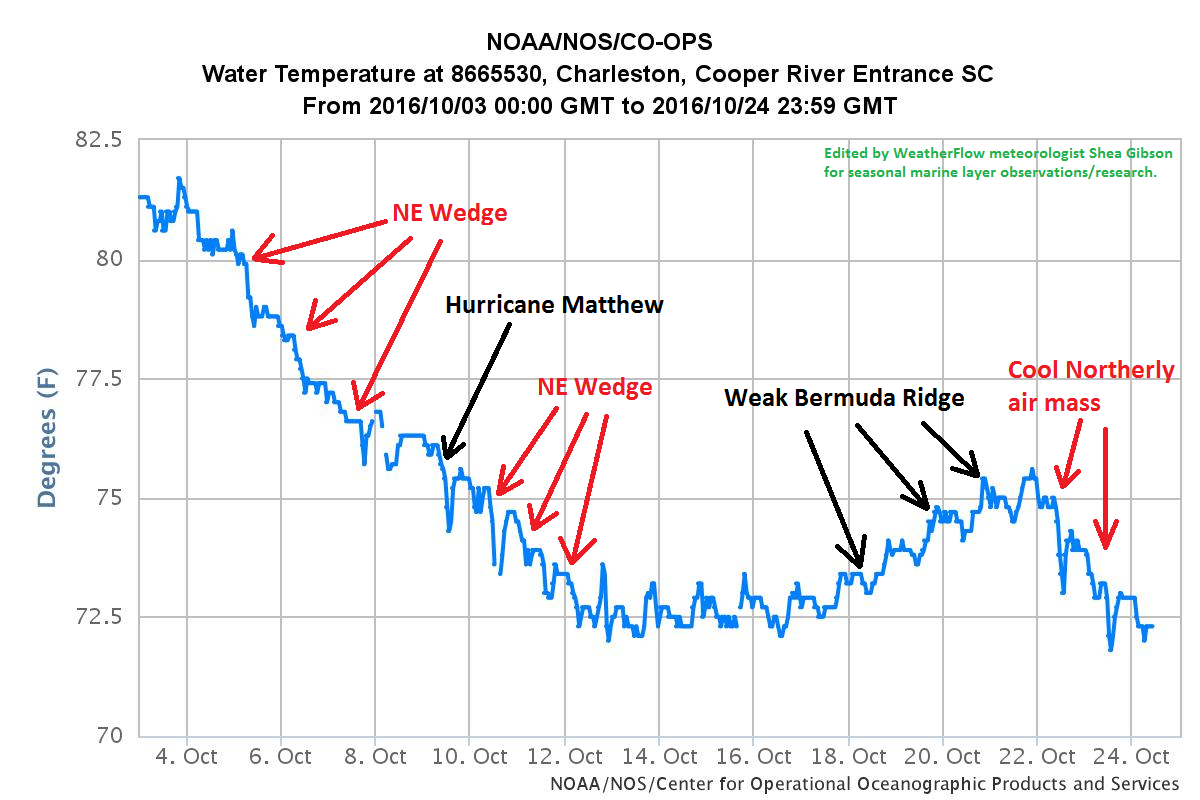
It’s that time of the year for “marine layering” again as water temps have cooled to the low 70’s. I’ve been recording when marine layering starts for the last 3 years in order to further document the initiating time periods. In the 2013, it started on Friday, November 1st. In 2014, it started much earlier on Friday, October 3. In both 2013-2014, we saw a 3-5 degree drops in two separate occasions with cold air intrusion and more NE/ENE events (“NE Wedge”). In 2015, it was a less substantial all-at-once drop and more of a progressive subtle feature that occurred during the October Rain Storm of 2015. This year we again saw a more progressive marine layering process as water temps slowly fell, with a double NE Wedge setup + Hurricane Matthew making landfall just north of Charleston along Copahee Sound/McClellanville, SC. The storm certainly plunged the water temps down several more knots as it stirred the surface, resulting in cool water upwelling followed by another NE Wedge and a cool air mass from the north. For this marine layer date, I place the initiation on Tuesday, November 18th.
Review:
The thing to remember here is that warm air masses tend to cause wind speeds to “decouple” over the cooler, more stable waters. This means that a layer of cooler air hangs over the cooler surface unless warm air is able to penetrate and mix into it for instability (instability = wind). Higher humidity levels are said to be a large part of the reason for decoupling; however, even with dry air over the coastal region, these layers create their own higher humidity levels at the surface. They are in many cases, their own body of dense cool air surface pooling.
See the previous blogs for past history:
2013: https://blog.weatherflow.com/1st-marine-layering-event-affects-se-region/
2014: https://blog.weatherflow.com/marine-layering-effects-start-in-the-se-region/
2015: https://blog.weatherflow.com/2015-fall-marine-layering-starts/
DETAILED ANALYSIS: https://blog.weatherflow.com/drawing-a-line-in-the-water/
We can see the trend from October 3 to near present yesterday 10/23/2016 in the NASA Sport SST animation, where coastal shelf waters along the immediate coast fell to around 73/74°…and have now fallen to ~72.3° as of today 10/24/16. You can also see the swirl, or surface eddy, that Matthew caused between October 8-10th in the warmer Gulf Stream well offshore.
Waters were ~81° on October 3, then a NE Wedge setup dropped waters a few degrees. Then Hurricane Matthew wobbled up the coastal SE Region on October 7-9 to further the cooling. Here is the SST from October 12 after Matthew was gone and the next NE Wedge pushed speeds further down to 72.7°.
We also saw an upwards surge in temps after that cooling period, but only made it to a bit over ~75°. Now we are at 72.3° as of October 24 due to a seasonal shot of Canadian air that recently made its way down into the SE. Here is an edited NOAA/NOA/CO-OPS Sea Surface temp chart going back to Oct 3. Notice the progressive trend, which is considered a normal timeline for cooling.
Ok so how did this affect the winds and how does this relate to marine layering?
I usually try to use a good bench mark, such as a strong cold front with a warm air mass ahead of it, to test for marine layering since we need warmer air over cooler waters. However, we can also look at our Southerly Sea Breezes with High pressure in the Atlantic creating the warm air mass as well.
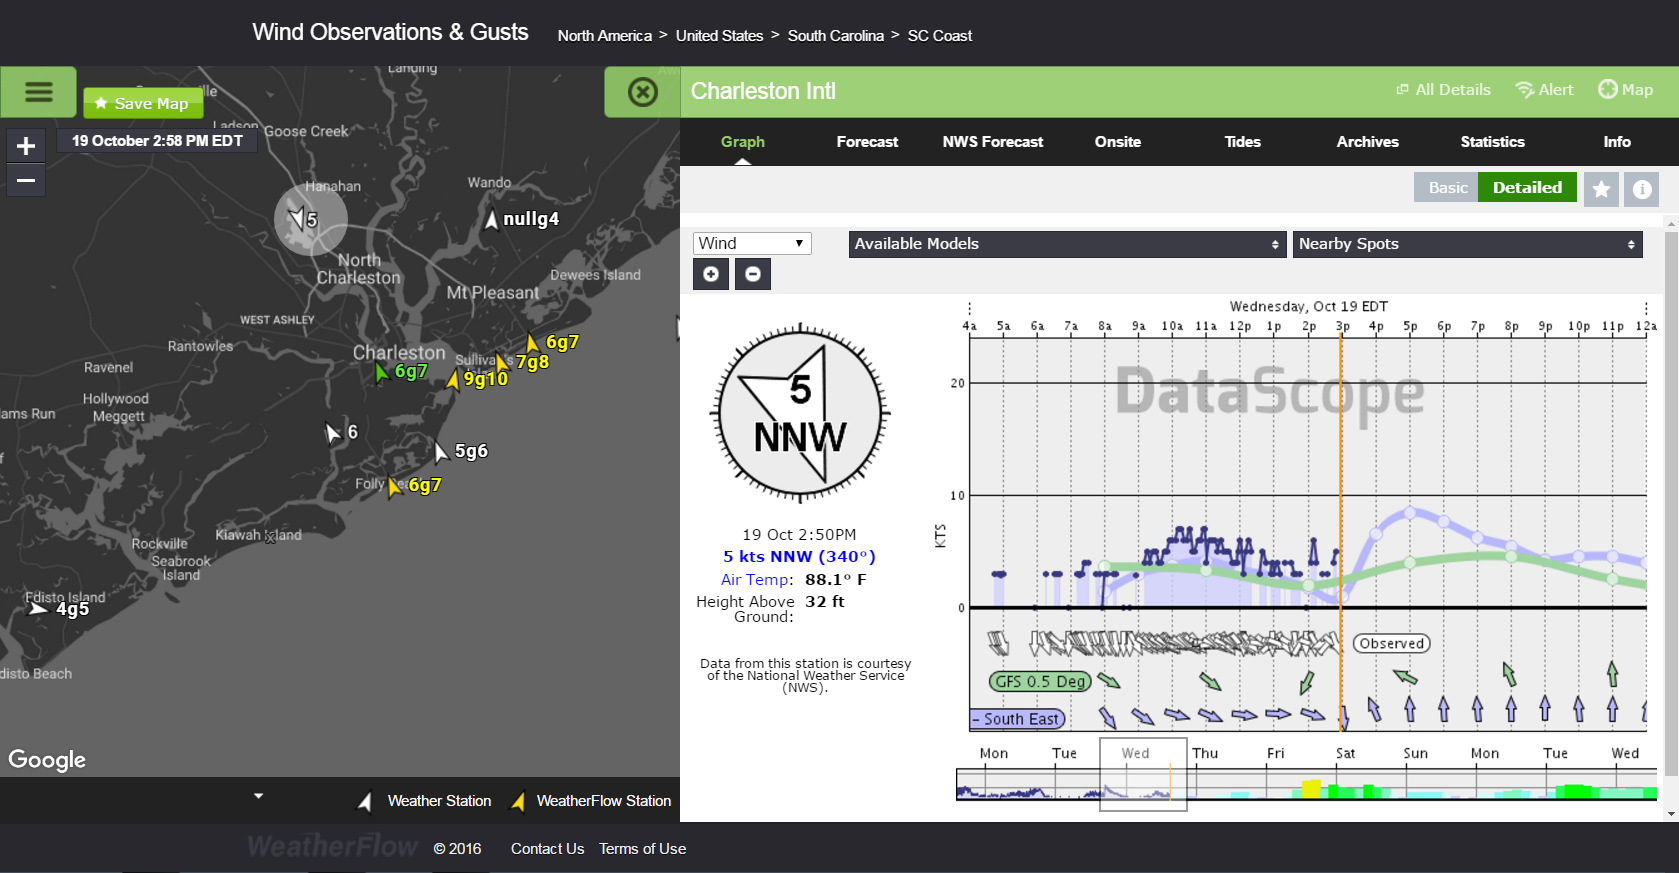
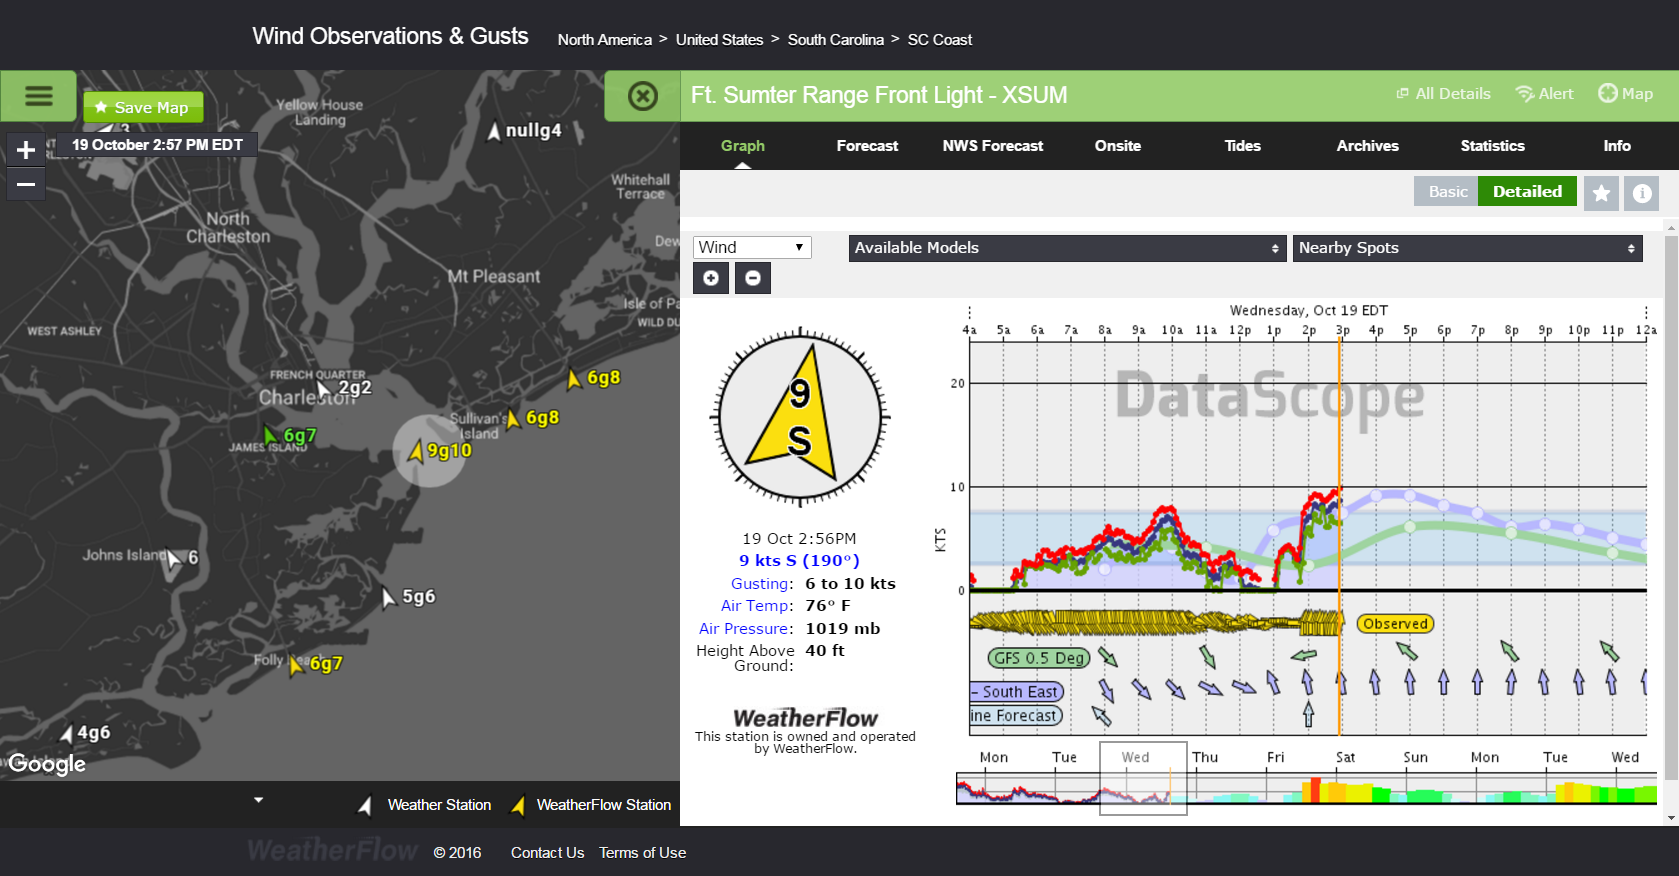
Here are the wind obs from Tuesday, October 18 (at 2:59PM) and Wednesday, October 19th (2:57PM) showing winds just inside the Charleston Harbor next to Fort Sumter a few knots higher than at the beaches on a straight South direction.
The air temps that day went all the way up to 87/88° around 15 miles inland at the Charleston International Airport. However, air temps were only 76-77° over the Chas Harbor and along the beaches with the cooler onshore flow.
The climate pattern for Tuesday and Wednesday consisted of a weak Bermuda ridge (weak Atlantic High pressure) allowing for modest Southerly Sea Breezes and hot air. The difference between the coastal break speeds and the beach speeds is a symptom of subtle marine layering where the beaches show less speed due to cooler SST’s (72.5-73°). Morris Island is just to the south of Fort Sumter, which provides the upwind land heat for higher speeds (wind mix down to the surface).
The line is very small between where it starts and where it ends, and you can see on some days during S/SSW/SW winds where it will be 25kts just inside the harbor and 10/11kts along the beaches – read my detailed blog about it here for more information: https://blog.weatherflow.com/drawing-a-line-in-the-water/
The layer may be too shallow for the naked eye on some days, but it can be often seen as a thin “haze” when the first signs show. The cooler the water temps and the hotter the air temps, the more visible this becomes- eventually becoming a very thick fog bank over the barrier islands.
Here is a pic from 2013 I took showing the thin haze looking from Sullivan’s Island towards Isle of Palms across Breach Inlet.
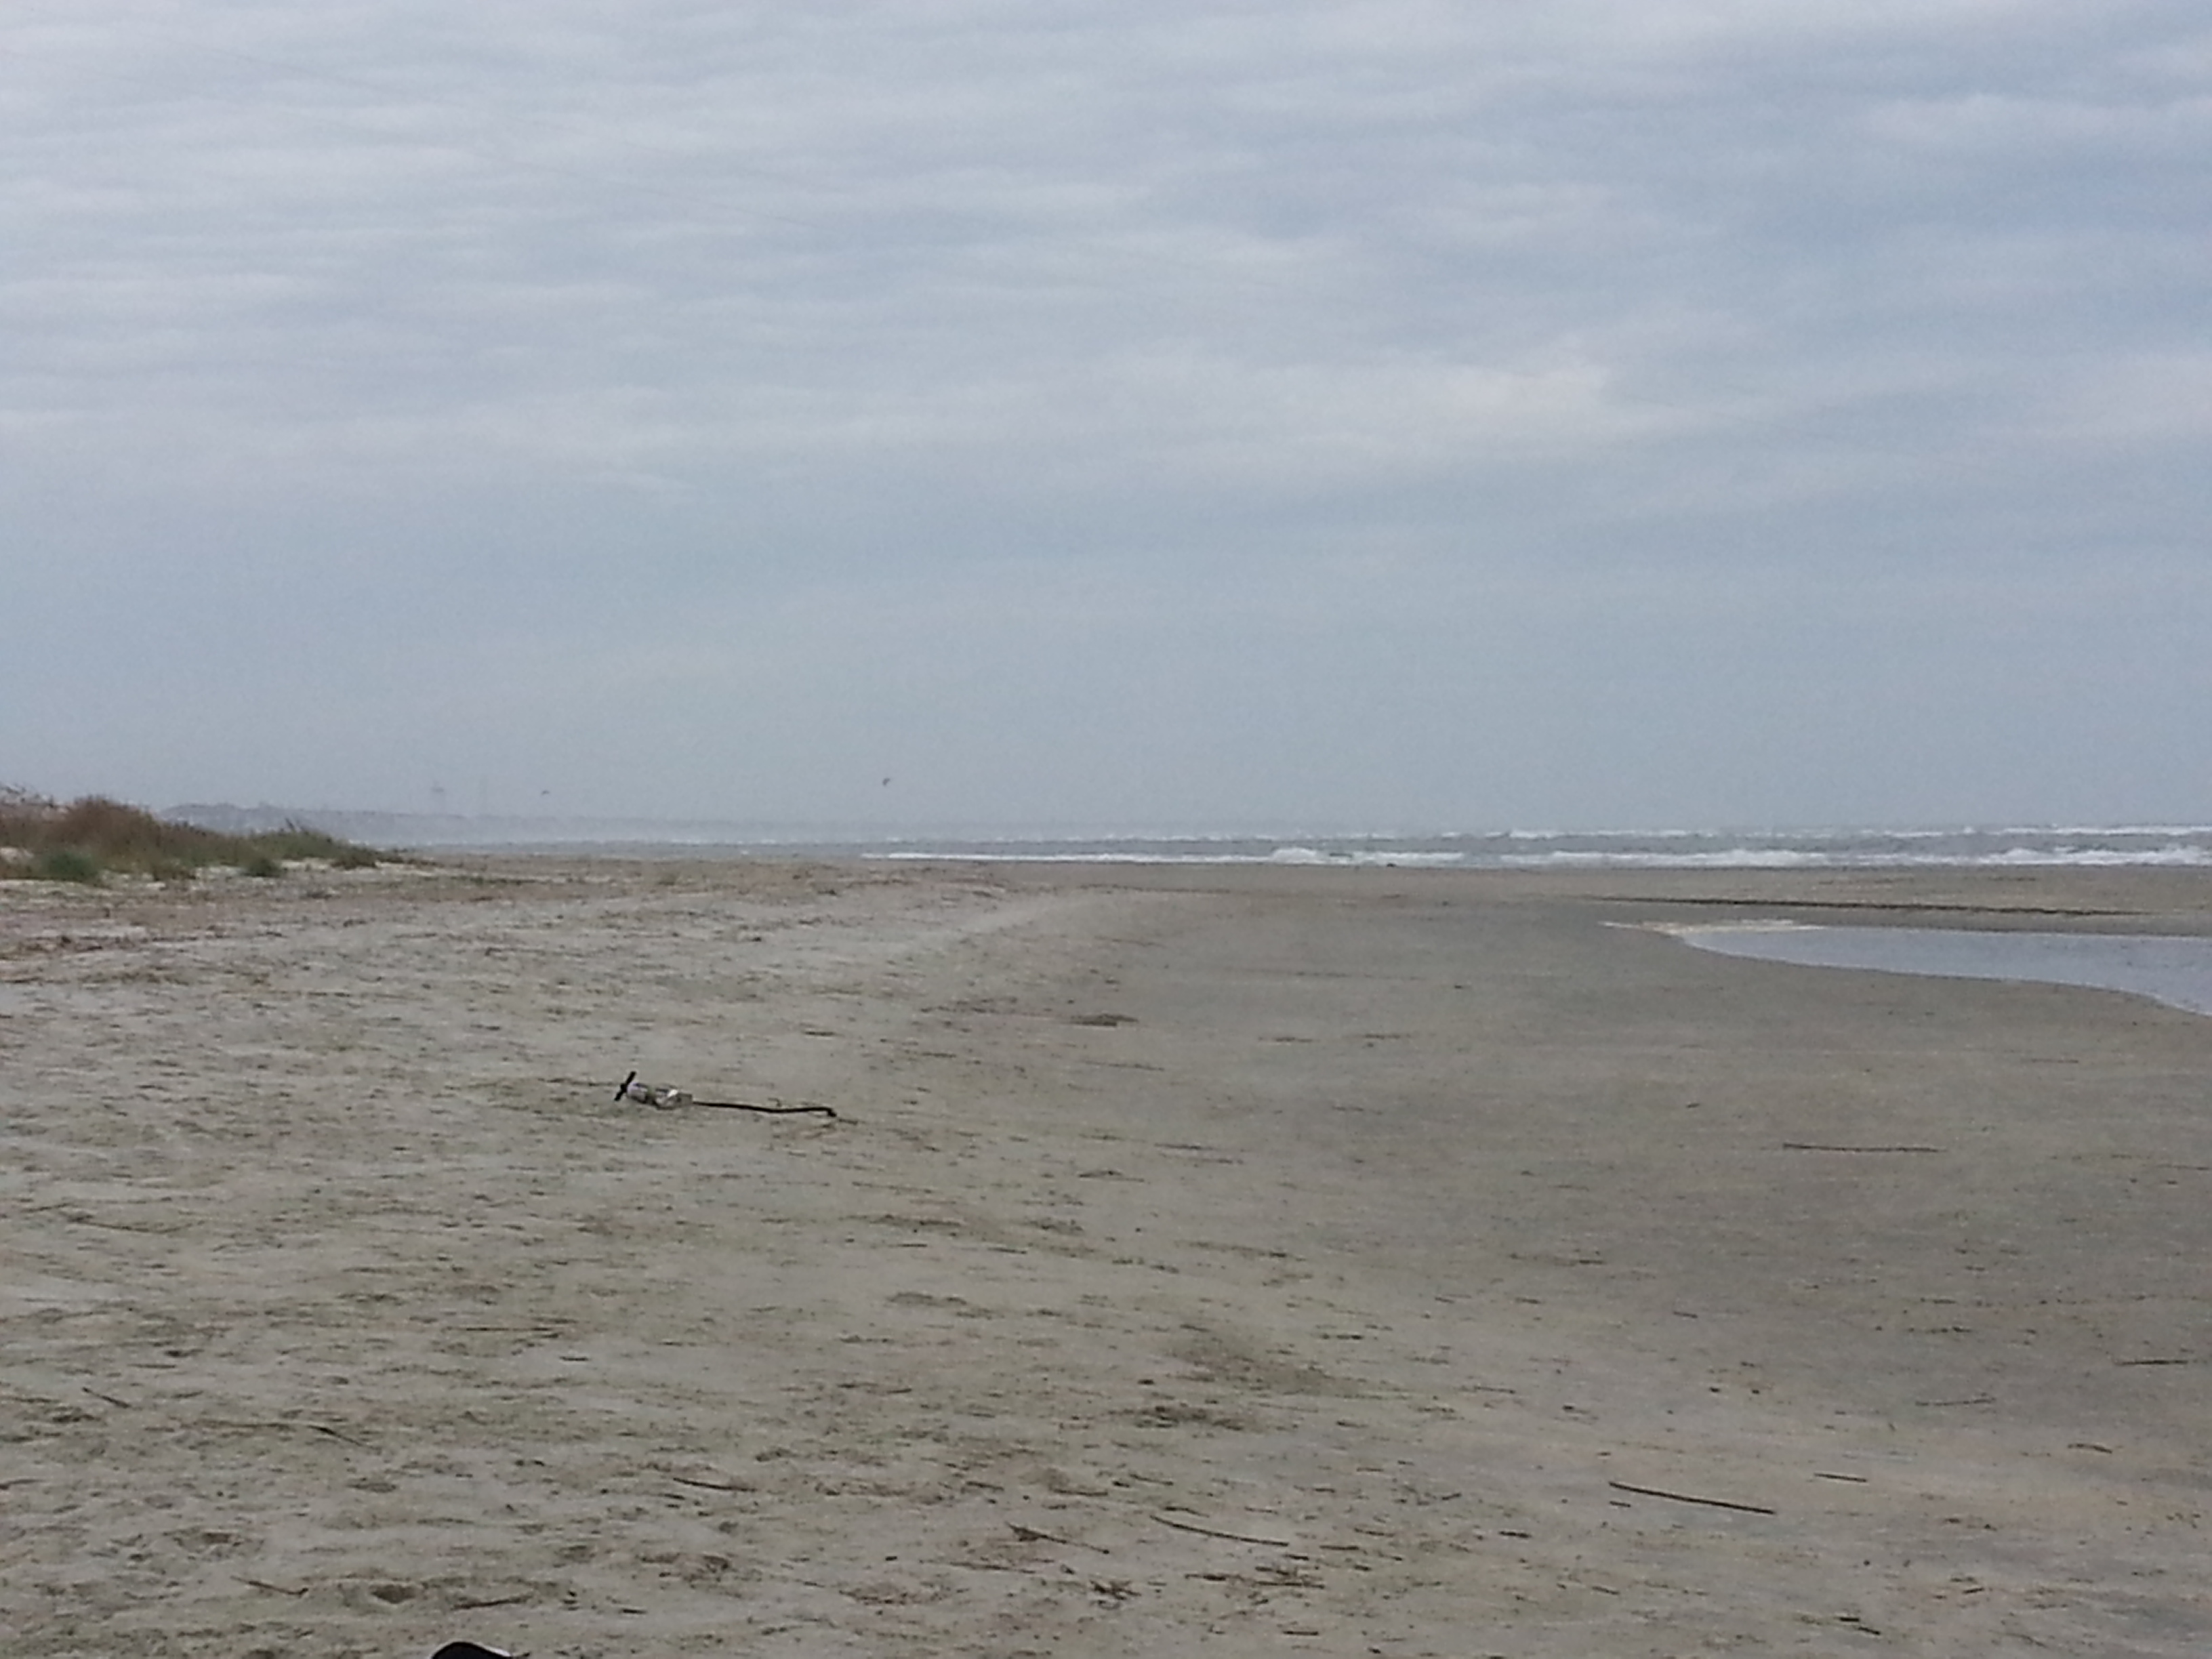
Here is a couple of pics from Rusty Williamson from Tuesday morning, October 18 from 3rd Street Isle of Palms facing SSE (tip of Sullivan’s Island far right). You can see the haze across the waters. Tuesday morning presented a shallow steam layer as low temps were near 64° as the sunrise added heat. This layer stuck through the day once air temps surpassed SST’s, but became less visible into the afternoon. I did notice a shallow haze layer remaining across the harbor that day during peak heating.
Last week on Friday, October 21st, we had a cold front drop into the SE Region with a warm air mass ahead of it, but the front did not develop over our area and it stayed fairly dry. The winds did, however, line up from the SSW/SW ahead of the front with air temps reaching mid to upper 80’s. The below radar loop was from the morning showing the cold front approach.
Now the SST’s had climbed back up to near ~75° – 76° by this time, so the marine layering was not an issue.
[The 76 degree mark has always been my theory on where the phenomena ends and where it begins. And usually in the spring, the cannonball jellyfish let us know it will be soon when SST’s will be rising above that mark. More on this here: https://blog.weatherflow.com/cannonballs-fire-the-first-warming-shot/ ]
Here are the wind obs from this past Friday- notice the coupling at the Isle of Palms beach showing low to mid teens (just like in the harbor) between 12PM-2:00PM. Then we see the post-frontal flow crank up in the harbor.
Fort Sumter just inside the Charleston Harbor:
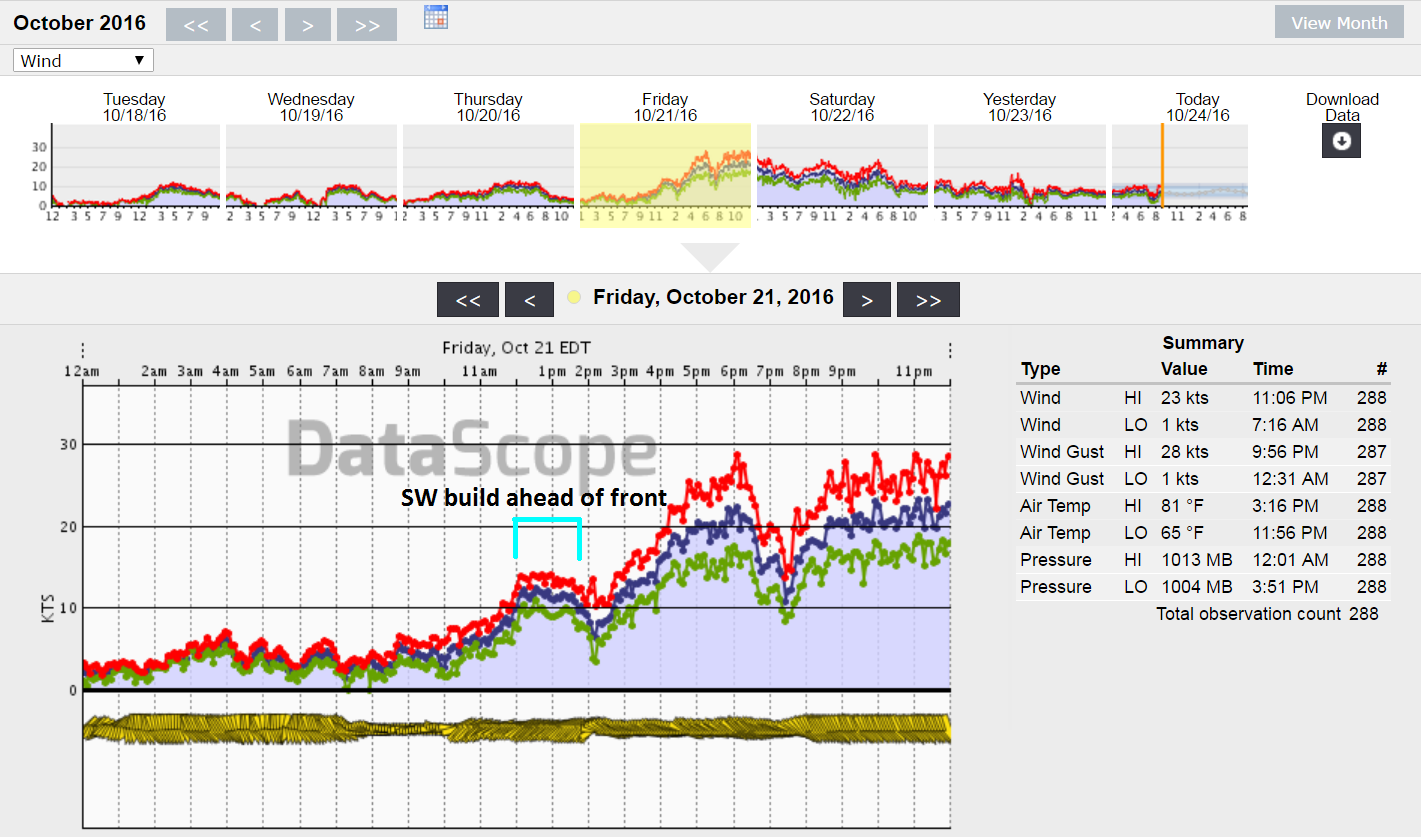
Isle of Palms Pier sensor (beach side):

So now we are back into the low 70’s with overnight lows expected to get us down near 70° this week, if not upper 60’s. We do have 2 weak backdoor cold fronts approaching today and later in the week on Thursday/Friday, so we’ll get to see further evidence. If significant, I will update here in this blog.
Until then or this spring when the marine layering ends for annual documentation…
Cheers!
Shea Gibson
WeatherFlow Meteorologist/Wind Forecaster
SE Region/East Coast/Tropics
Outreach & New Station Projects
How to find me:
Twitter: @WeatherFlowCHAS
Facebook:
Wind Alert – https://www.facebook.com/windalert/
WeatherFlowCHAS – https://www.facebook.com/WeatherFlowCHAS/
Chucktown Wind Report – https://www.facebook.com/groups/ChucktownWindReport/
Sources for this blog: NASA SPoRT, WSV3 radar software, NOAA Tides and Currents, Rusty Williamson on Twitter


